Answered step by step
Verified Expert Solution
Question
1 Approved Answer
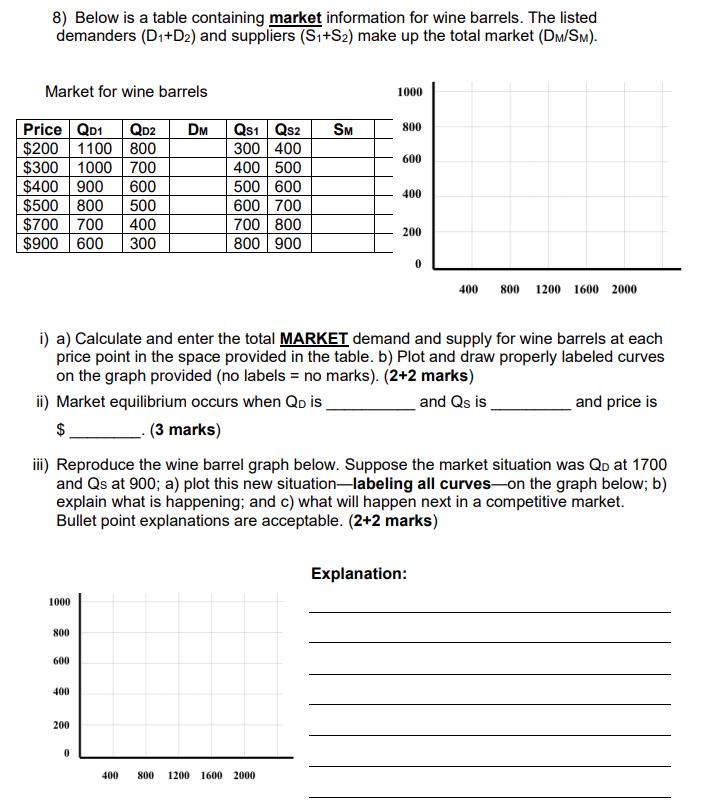
8) Below is a table containing market information for wine barrels. The listed demanders (D1+D2) and suppliers (S+S2) make up the total market (DM/SM).

8) Below is a table containing market information for wine barrels. The listed demanders (D1+D2) and suppliers (S+S2) make up the total market (DM/SM). Market for wine barrels 1000 Price QD1 QD2 DM QS1 QS2 SM 800 $200 1100 800 300 400 600 $300 1000 700 400 500 $400 900 600 500 600 400 $500 800 500 600 700 $700 700 400 700 800 200 $900 600 300 800 900 0 400 800 1200 1600 2000 i) a) Calculate and enter the total MARKET demand and supply for wine barrels at each price point in the space provided in the table. b) Plot and draw properly labeled curves on the graph provided (no labels = no marks). (2+2 marks) ii) Market equilibrium occurs when QD is. and Qs is and price is $ (3 marks) iii) Reproduce the wine barrel graph below. Suppose the market situation was QD at 1700 and Qs at 900; a) plot this new situation-labeling all curves-on the graph below; b) explain what is happening; and c) what will happen next in a competitive market. Bullet point explanations are acceptable. (2+2 marks) 1000 800 600 400 200 0 400 800 1200 1600 2000 Explanation:
Step by Step Solution
There are 3 Steps involved in it
Step: 1
i a To calculate the total market demand and supply for wine barrels at each price point you w...
Get Instant Access to Expert-Tailored Solutions
See step-by-step solutions with expert insights and AI powered tools for academic success
Step: 2

Step: 3

Ace Your Homework with AI
Get the answers you need in no time with our AI-driven, step-by-step assistance
Get Started


