Answered step by step
Verified Expert Solution
Link Copied!

Question

1 Approved Answer

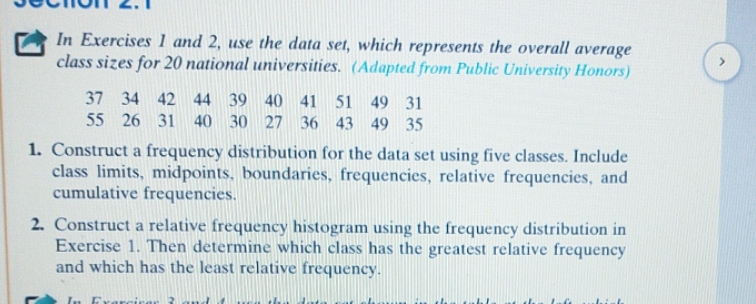
descriptive statistics In Exercises I and 2, use the data set, which represents the overall average class sizes for 20 national universities. (Adapted from Public

descriptive statistics

image text in transcribed
In Exercises I and 2, use the data set, which represents the overall average class sizes for 20 national universities. (Adapted from Public University Honors) 37 34 42 44 39 40 41 51 49 31 55 26 31 40 30 27 36 43 49 35 1. Construct a frequency distribution for the data set using five classes. Include class limits, midpoints, boundaries, frequencies, relative frequencies, and cumulative frequencies. 2. Construct a relative frequency histogram using the frequency distribution in Exercise 1. Then determine which class has the greatest relative frequency and which has the least relative frequency

Step by Step Solution

There are 3 Steps involved in it

Step: 1

blur-text-image

Get Instant Access to Expert-Tailored Solutions

See step-by-step solutions with expert insights and AI powered tools for academic success

Step: 2

blur-text-image

Step: 3

blur-text-image

Ace Your Homework with AI

Get the answers you need in no time with our AI-driven, step-by-step assistance

Get Started

Recommended Textbook for

Calculus

Authors: Laura Taalman, Peter Kohn

1st Edition

ISBN: 1464153035, 9781464153037

More Books

Students also viewed these Mathematics questions