Question: - DO NOT SEND CODE THAT HAS ALREADY BEEN POSTED ON CHEGG. THOSE ANSWERS DON'T WORK - DO NOT HAVE COMMENTS IN THE CODE -
- DO NOT SEND CODE THAT HAS ALREADY BEEN POSTED ON CHEGG. THOSE ANSWERS DON'T WORK
- DO NOT HAVE COMMENTS IN THE CODE
- WRITE CODE IN JAVA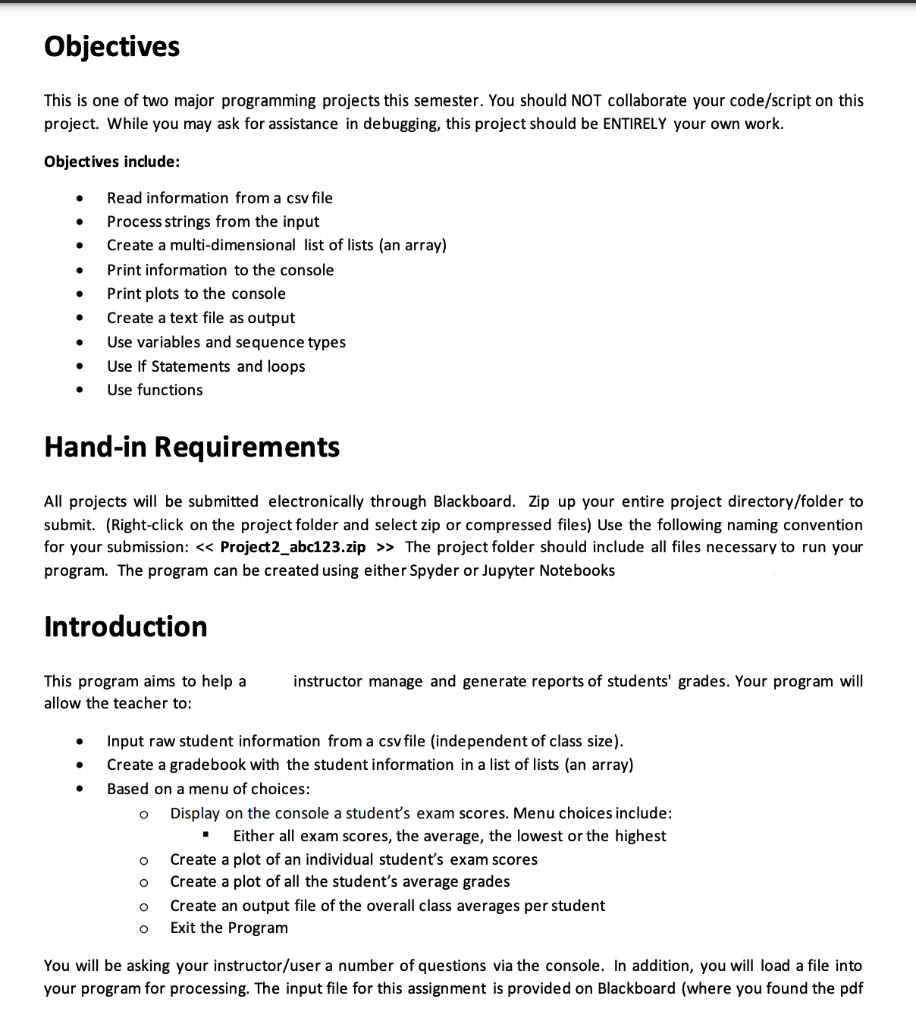
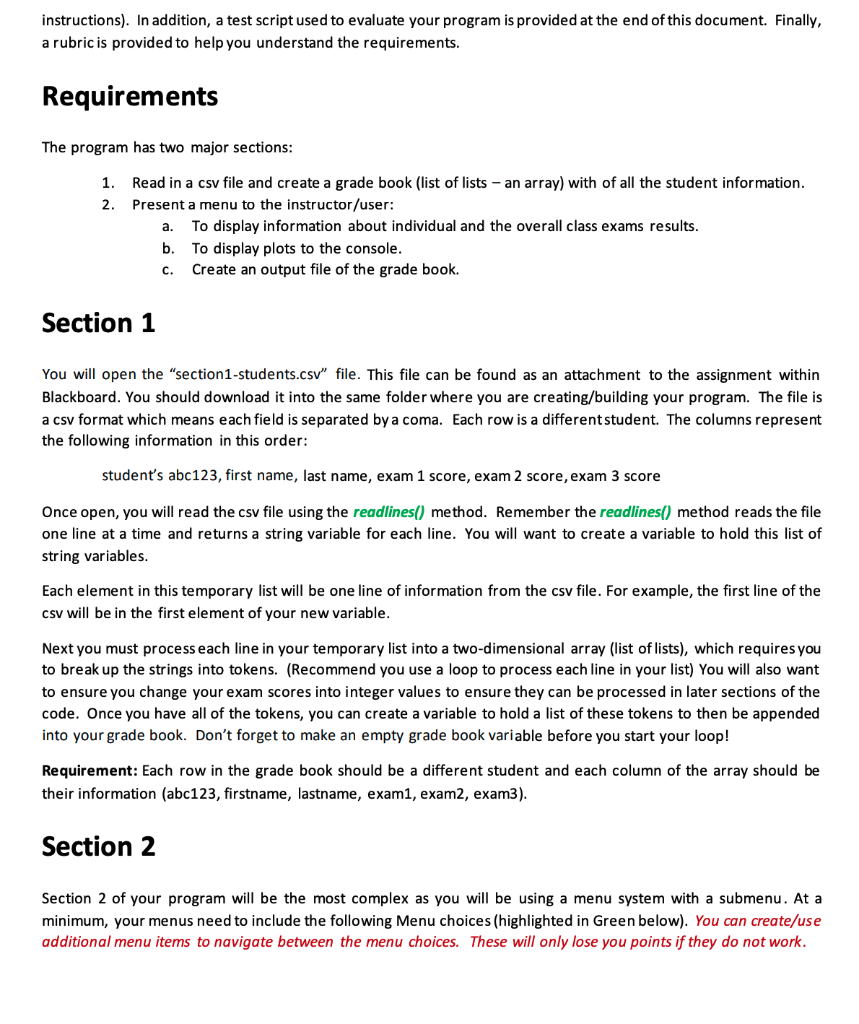
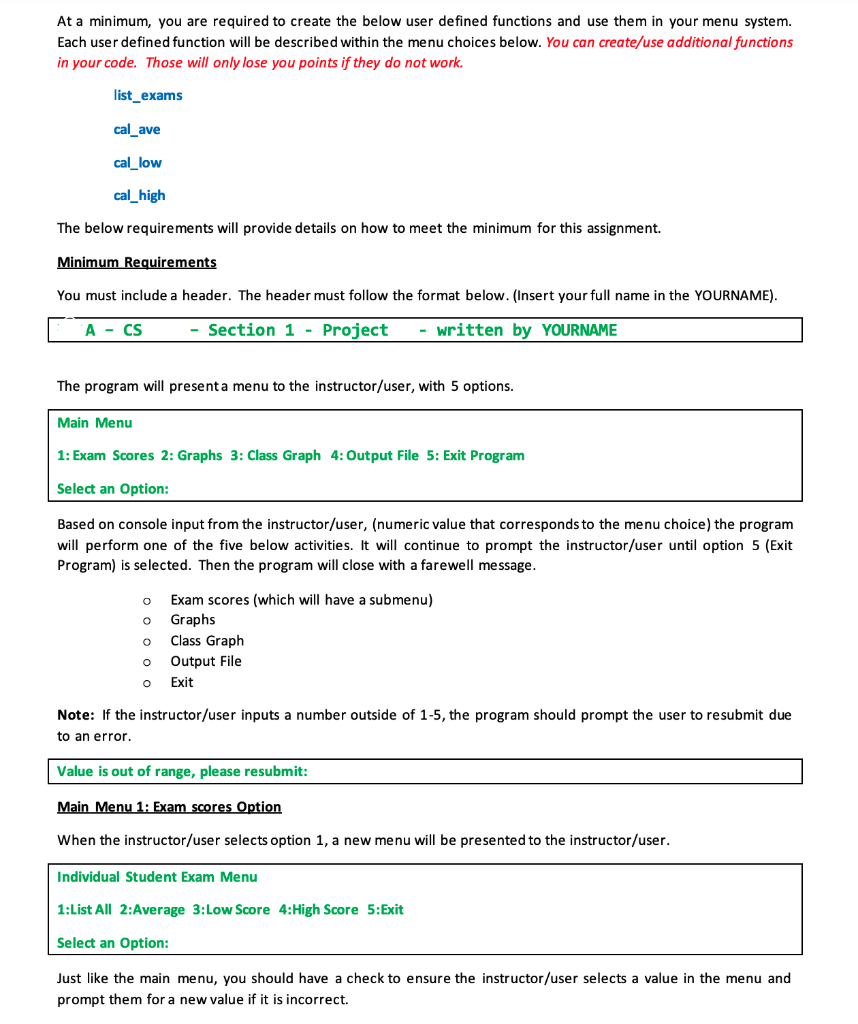
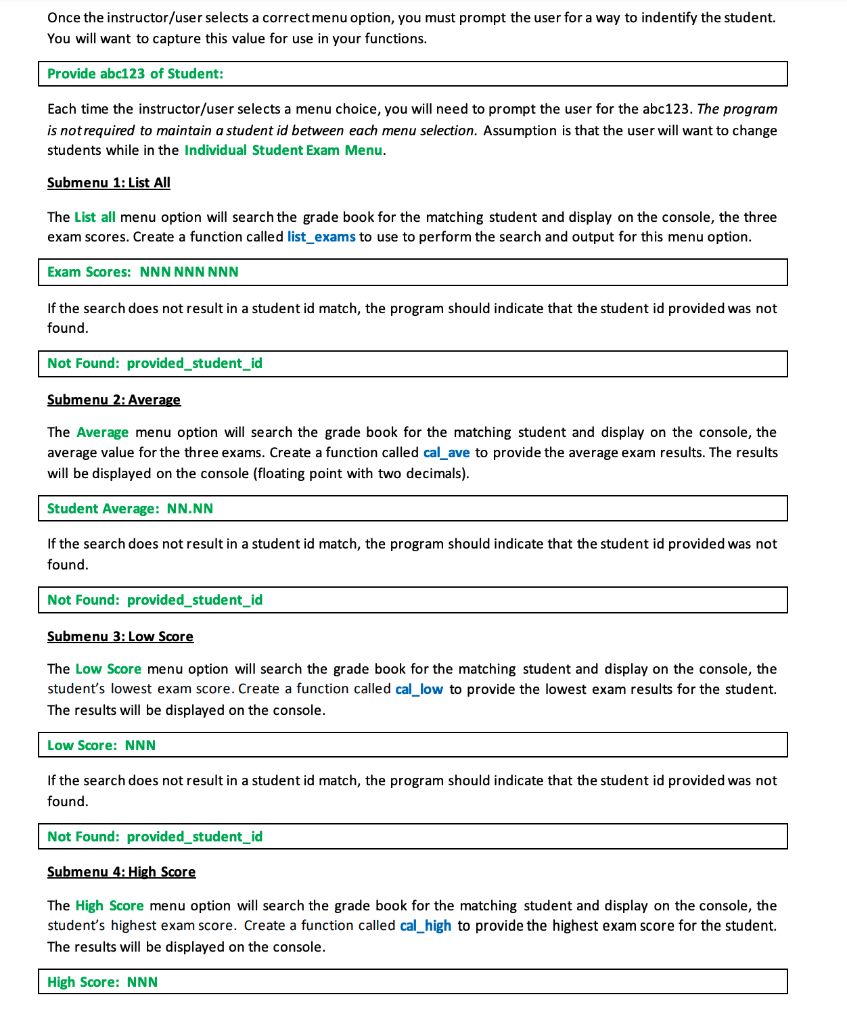
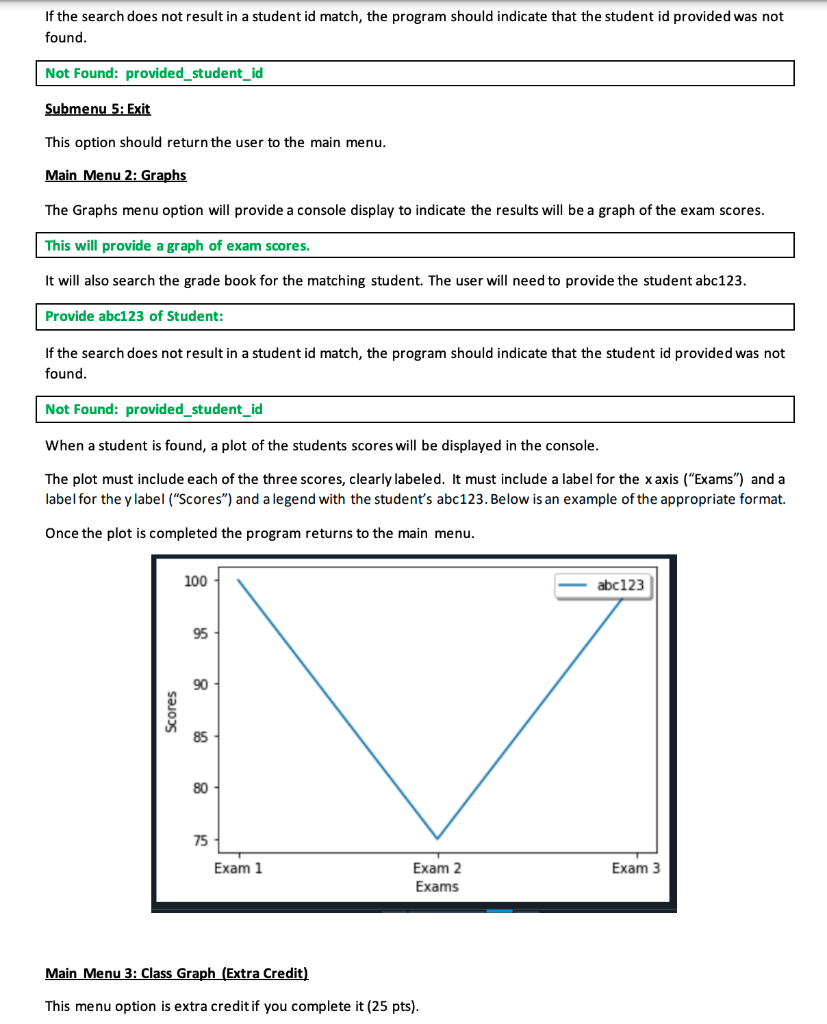
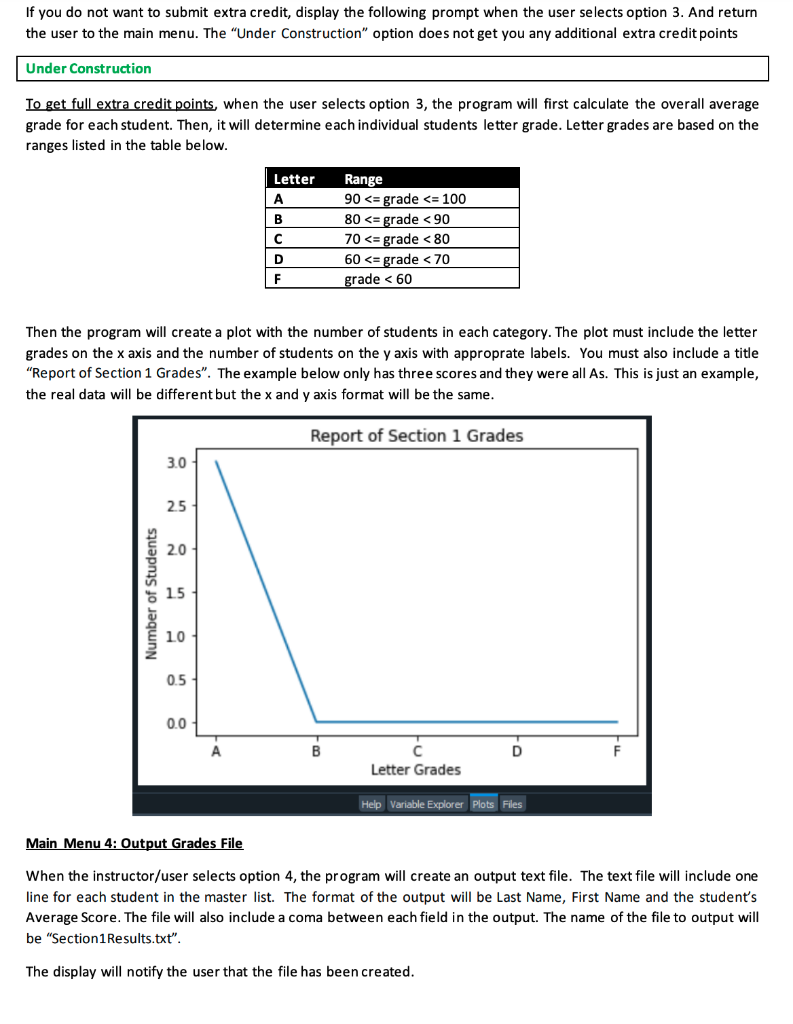
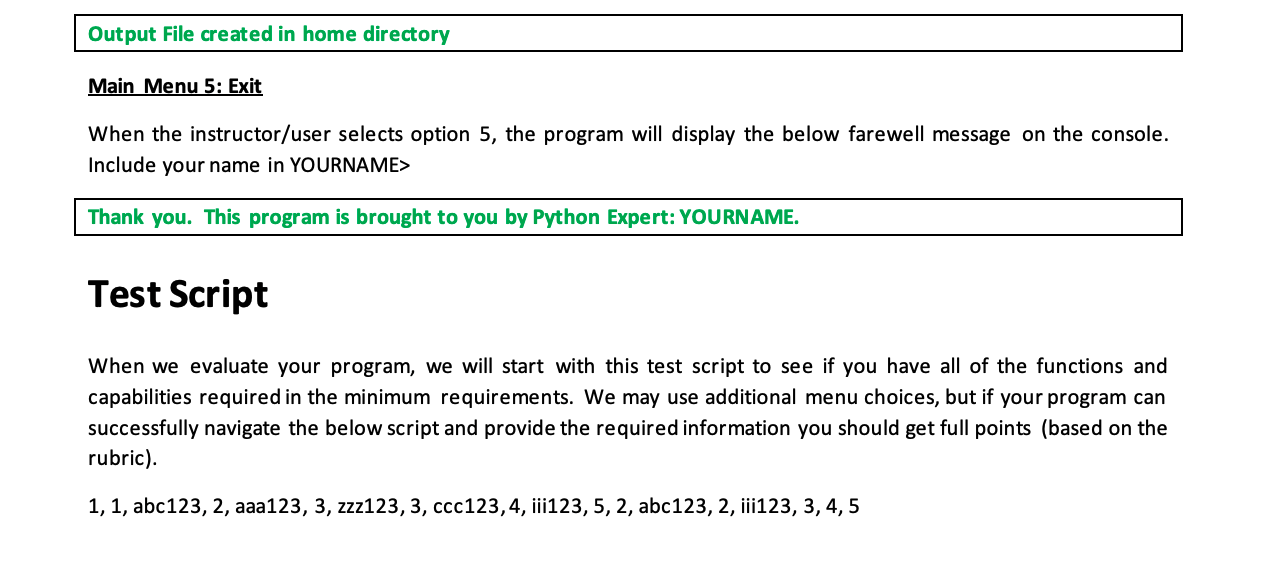
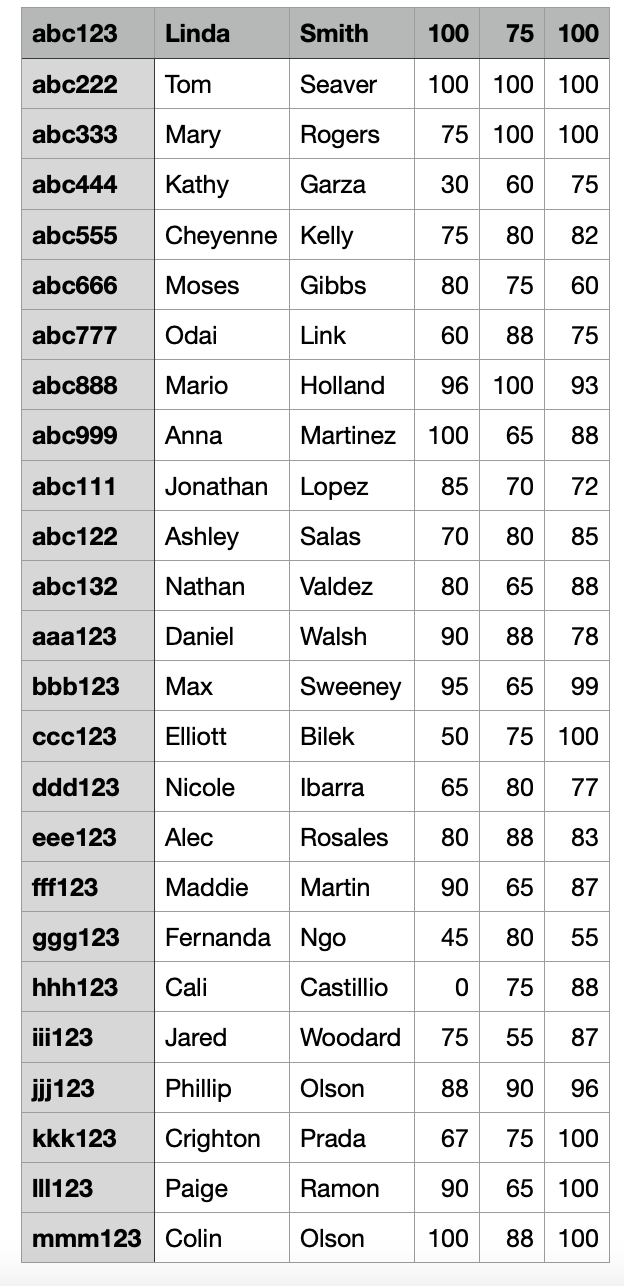
Objectives This is one of two major programming projects this semester. You should NOT collaborate your code/script on this project. While you may ask for assistance in debugging, this project should be ENTIRELY your own work. Objectives include: - Read information from a csv file - Process strings from the input - Create a multi-dimensional list of lists (an array) - Print information to the console - Print plots to the console - Create a text file as output - Use variables and sequence types - Use If Statements and loops - Use functions Hand-in Requirements All projects will be submitted electronically through Blackboard. Zip up your entire project directory/folder to submit. (Right-click on the project folder and select zip or compressed files) Use the following naming convention for your submission: - Project2_abc123.zip The project folder should include all files necessary to run your program. The program can be created using either Spyder or Jupyter Notebooks Introduction This program aims to help a instructor manage and generate reports of students' grades. Your program will allow the teacher to: - Input raw student information from a csv file (independent of class size). - Create a gradebook with the student information in a list of lists (an array) - Based on a menu of choices: - Display on the console a student's exam scores. Menu choices include: - Either all exam scores, the average, the lowest or the highest - Create a plot of an individual student's exam scores - Create a plot of all the student's average grades - Create an output file of the overall class averages per student - Exit the Program You will be asking your instructor/user a number of questions via the console. In addition, you will load a file into your program for processing. The input file for this assignment is provided on Blackboard (where you found the pdf instructions). In addition, a test script used to evaluate your program is provided at the end of this document. Finally, a rubric is provided to help you understand the requirements. Requirements The program has two major sections: 1. Read in a csv file and create a grade book (list of lists - an array) with of all the student information. 2. Present a menu to the instructor/user: a. To display information about individual and the overall class exams results. b. To display plots to the console. c. Create an output file of the grade book. Section 1 You will open the "section1-students.csv" file. This file can be found as an attachment to the assignment within Blackboard. You should download it into the same folder where you are creating/building your program. The file is a csv format which means each field is separated by a coma. Each row is a different student. The columns represent the following information in this order: student's abc123, first name, last name, exam 1 score, exam 2 score, exam 3 score Once open, you will read the csv file using the readlines() method. Remember the readlines() method reads the file one line at a time and returns a string variable for each line. You will want to create a variable to hold this list of string variables. Each element in this temporary list will be one line of information from the csv file. For example, the first line of the csv will be in the first element of your new variable. Next you must process each line in your temporary list into a two-dimensional array (list of lists), which requires you to break up the strings into tokens. (Recommend you use a loop to process each line in your list) You will also want to ensure you change your exam scores into integer values to ensure they can be processed in later sections of the code. Once you have all of the tokens, you can create a variable to hold a list of these tokens to then be appended into your grade book. Don't forget to make an empty grade book variable before you start your loop! Requirement: Each row in the grade book should be a different student and each column of the array should be their information (abc123, firstname, lastname, exam1, exam2, exam3). Section 2 Section 2 of your program will be the most complex as you will be using a menu system with a submenu. At a minimum, your menus need to include the following Menu choices (highlighted in Green below). You can create/use additional menu items to navigate between the menu choices. These will only lose you points if they do not work. At a minimum, you are required to create the below user defined functions and use them in your menu system. Each user defined function will be described within the menu choices below. You can create/use additional functions in your code. Those will only lose you points if they do not work. \[ \begin{array}{l} \text { list_exams } \\ \text { cal_ave } \\ \text { cal_low } \\ \text { cal_high } \end{array} \] The below requirements will provide details on how to meet the minimum for this assignment. Minimum Requirements You must include a header. The header must follow the format below. (Insert your full name in the YOURNAME). [A-CS The program will presenta menu to the instructor/user, with 5 options. Main Menu 1: Exam Scores 2: Graphs 3: Class Graph 4: Output File 5: Exit Program Select an Option: Based on console input from the instructor/user, (numeric value that corresponds to the menu choice) the program will perform one of the five below activities. It will continue to prompt the instructor/user until option 5 (Exit Program) is selected. Then the program will close with a farewell message. Exam scores (which will have a submenu) Graphs Class Graph Output File Exit Note: If the instructor/user inputs a number outside of 1-5, the program should prompt the user to resubmit due to an error. Value is out of range, please resubmit: Main Menu 1: Exam scores Option When the instructor/user selects option 1, a new menu will be presented to the instructor/user. Individual Student Exam Menu 1:List All 2:Average 3:Low Score 4:High Score 5:Exit Select an Option: Just like the main menu, you should have a check to ensure the instructor/user selects a value in the menu and prompt them for a new value if it is incorrect. Once the instructor/user selects a correct menu option, you must prompt the user for a way to indentify the student. You will want to capture this value for use in your functions. Provide abc123 of Student: Each time the instructor/user selects a menu choice, you will need to prompt the user for the abc123. The program is not required to maintain a student id between each menu selection. Assumption is that the user will want to change students while in the Individual Student Exam Menu. Submenu 1: List All The List all menu option will search the grade book for the matching student and display on the console, the three exam scores. Create a function called list_exams to use to perform the search and output for this menu option. [ If the search does not result in a student id match, the program should indicate that the student id provided was not found. Not Found: provided_student_id Submenu 2: Average The Average menu option will search the grade book for the matching student and display on the console, the average value for the three exams. Create a function called cal_ave to provide the average exam results. The results will be displayed on the console (floating point with two decimals). Student Average: NN.NN If the search does not result in a student id match, the program should indicate that the student id provided was not found. Not Found: provided_student_id Submenu 3: Low Score The Low Score menu option will search the grade book for the matching student and display on the console, the student's lowest exam score. Create a function called cal_low to provide the lowest exam results for the student. The results will be displayed on the console. Low Score: NNN If the search does not result in a student id match, the program should indicate that the student id provided was not found. Not Found: provided_student_id Submenu 4: High Score The High Score menu option will search the grade book for the matching student and display on the console, the student's highest exam score. Create a function called cal_high to provide the highest exam score for the student. The results will be displayed on the console. If the search does not result in a student id match, the program should indicate that the student id provided was not found. Not Found: provided_student_id Submenu 5: Exit This option should return the user to the main menu. Main Menu 2: Graphs The Graphs menu option will provide a console display to indicate the results will be a graph of the exam scores. This will provide a graph of exam scores. It will also search the grade book for the matching student. The user will need to provide the student abc 123. Provide abc123 of Student: If the search does not result in a student id match, the program should indicate that the student id provided was not found. Not Found: provided_student_id When a student is found, a plot of the students scores will be displayed in the console. The plot must include each of the three scores, clearly labeled. It must include a label for the x axis ("Exams") and a label for the y label ("Scores") and a legend with the student's abc123. Below is an example of the appropriate format. Once the plot is completed the program returns to the main menu. Main Menu 3: Class Graph (Extra Credit) This menu option is extra credit if you complete it ( 25pts ). If you do not want to submit extra credit, display the following prompt when the user selects option 3 . And return the user to the main menu. The "Under Construction" option does not get you any additional extra credit points Under Construction To get full extra credit points, when the user selects option 3, the program will first calculate the overall average grade for each student. Then, it will determine each individual students letter grade. Letter grades are based on the ranges listed in the table below. Then the program will create a plot with the number of students in each category. The plot must include the letter grades on the x axis and the number of students on the y axis with approprate labels. You must also include a title "Report of Section 1 Grades". The example below only has three scores and they were all As. This is just an example, the real data will be different but the x and y axis format will be the same. Main Menu 4: Output Grades File When the instructor/user selects option 4, the program will create an output text file. The text file will include one line for each student in the master list. The format of the output will be Last Name, First Name and the student's Average Score. The file will also include a coma between each field in the output. The name of the file to output will be "Section1Results.txt". The display will notify the user that the file has been created. Main Menu 5: Exit When the instructor/user selects option 5, the program will display the below farewell message on the console. Include your name in YOURNAME> Thank you. This program is brought to you by Python Expert: YOURNAME. Test Script When we evaluate your program, we will start with this test script to see if you have all of the functions and capabilities required in the minimum requirements. We may use additional menu choices, but if your program can successfully navigate the below script and provide the required information you should get full points (based on the rubric). 1, 1, abc123, 2, aaa123, 3, zzz123, 3, ccc123, 4, iii123, 5, 2, abc 123,2 , iii123, 3, 4, 5 \begin{tabular}{|l|l|l|r|r|r|} \hline abc123 & Linda & Smith & 100 & 75 & 100 \\ \hline abc222 & Tom & Seaver & 100 & 100 & 100 \\ \hline abc333 & Mary & Rogers & 75 & 100 & 100 \\ \hline abc444 & Kathy & Garza & 30 & 60 & 75 \\ \hline abc555 & Cheyenne & Kelly & 75 & 80 & 82 \\ \hline abc666 & Moses & Gibbs & 80 & 75 & 60 \\ \hline abc777 & Odai & Link & 60 & 88 & 75 \\ \hline abc888 & Mario & Holland & 96 & 100 & 93 \\ \hline abc999 & Anna & Martinez & 100 & 65 & 88 \\ \hline abc111 & Jonathan & Lopez & 85 & 70 & 72 \\ \hline abc122 & Ashley & Salas & 70 & 80 & 85 \\ \hline abc132 & Nathan & Valdez & 80 & 65 & 88 \\ \hline aaa123 & Daniel & Walsh & 90 & 88 & 78 \\ \hline bbb123 & Max & Sweeney & 95 & 65 & 99 \\ \hline ccc123 & Elliott & Bilek & 50 & 75 & 100 \\ \hline ddd123 & Nicole & lbarra & 65 & 80 & 77 \\ \hline eee123 & Alec & Rosales & 80 & 88 & 83 \\ \hline fff123 & Maddie & Martin & 90 & 65 & 87 \\ \hline ggg123 & Fernanda & Ngo & 45 & 80 & 55 \\ \hline hhm123 & Cali & Castillio & 0 & 75 & 88 \\ \hline Jared & Whillip & Olsodard & 75 & 55 & 87 \\ \hline \end{tabular} Objectives This is one of two major programming projects this semester. You should NOT collaborate your code/script on this project. While you may ask for assistance in debugging, this project should be ENTIRELY your own work. Objectives include: - Read information from a csv file - Process strings from the input - Create a multi-dimensional list of lists (an array) - Print information to the console - Print plots to the console - Create a text file as output - Use variables and sequence types - Use If Statements and loops - Use functions Hand-in Requirements All projects will be submitted electronically through Blackboard. Zip up your entire project directory/folder to submit. (Right-click on the project folder and select zip or compressed files) Use the following naming convention for your submission: - Project2_abc123.zip The project folder should include all files necessary to run your program. The program can be created using either Spyder or Jupyter Notebooks Introduction This program aims to help a instructor manage and generate reports of students' grades. Your program will allow the teacher to: - Input raw student information from a csv file (independent of class size). - Create a gradebook with the student information in a list of lists (an array) - Based on a menu of choices: - Display on the console a student's exam scores. Menu choices include: - Either all exam scores, the average, the lowest or the highest - Create a plot of an individual student's exam scores - Create a plot of all the student's average grades - Create an output file of the overall class averages per student - Exit the Program You will be asking your instructor/user a number of questions via the console. In addition, you will load a file into your program for processing. The input file for this assignment is provided on Blackboard (where you found the pdf instructions). In addition, a test script used to evaluate your program is provided at the end of this document. Finally, a rubric is provided to help you understand the requirements. Requirements The program has two major sections: 1. Read in a csv file and create a grade book (list of lists - an array) with of all the student information. 2. Present a menu to the instructor/user: a. To display information about individual and the overall class exams results. b. To display plots to the console. c. Create an output file of the grade book. Section 1 You will open the "section1-students.csv" file. This file can be found as an attachment to the assignment within Blackboard. You should download it into the same folder where you are creating/building your program. The file is a csv format which means each field is separated by a coma. Each row is a different student. The columns represent the following information in this order: student's abc123, first name, last name, exam 1 score, exam 2 score, exam 3 score Once open, you will read the csv file using the readlines() method. Remember the readlines() method reads the file one line at a time and returns a string variable for each line. You will want to create a variable to hold this list of string variables. Each element in this temporary list will be one line of information from the csv file. For example, the first line of the csv will be in the first element of your new variable. Next you must process each line in your temporary list into a two-dimensional array (list of lists), which requires you to break up the strings into tokens. (Recommend you use a loop to process each line in your list) You will also want to ensure you change your exam scores into integer values to ensure they can be processed in later sections of the code. Once you have all of the tokens, you can create a variable to hold a list of these tokens to then be appended into your grade book. Don't forget to make an empty grade book variable before you start your loop! Requirement: Each row in the grade book should be a different student and each column of the array should be their information (abc123, firstname, lastname, exam1, exam2, exam3). Section 2 Section 2 of your program will be the most complex as you will be using a menu system with a submenu. At a minimum, your menus need to include the following Menu choices (highlighted in Green below). You can create/use additional menu items to navigate between the menu choices. These will only lose you points if they do not work. At a minimum, you are required to create the below user defined functions and use them in your menu system. Each user defined function will be described within the menu choices below. You can create/use additional functions in your code. Those will only lose you points if they do not work. \[ \begin{array}{l} \text { list_exams } \\ \text { cal_ave } \\ \text { cal_low } \\ \text { cal_high } \end{array} \] The below requirements will provide details on how to meet the minimum for this assignment. Minimum Requirements You must include a header. The header must follow the format below. (Insert your full name in the YOURNAME). [A-CS The program will presenta menu to the instructor/user, with 5 options. Main Menu 1: Exam Scores 2: Graphs 3: Class Graph 4: Output File 5: Exit Program Select an Option: Based on console input from the instructor/user, (numeric value that corresponds to the menu choice) the program will perform one of the five below activities. It will continue to prompt the instructor/user until option 5 (Exit Program) is selected. Then the program will close with a farewell message. Exam scores (which will have a submenu) Graphs Class Graph Output File Exit Note: If the instructor/user inputs a number outside of 1-5, the program should prompt the user to resubmit due to an error. Value is out of range, please resubmit: Main Menu 1: Exam scores Option When the instructor/user selects option 1, a new menu will be presented to the instructor/user. Individual Student Exam Menu 1:List All 2:Average 3:Low Score 4:High Score 5:Exit Select an Option: Just like the main menu, you should have a check to ensure the instructor/user selects a value in the menu and prompt them for a new value if it is incorrect. Once the instructor/user selects a correct menu option, you must prompt the user for a way to indentify the student. You will want to capture this value for use in your functions. Provide abc123 of Student: Each time the instructor/user selects a menu choice, you will need to prompt the user for the abc123. The program is not required to maintain a student id between each menu selection. Assumption is that the user will want to change students while in the Individual Student Exam Menu. Submenu 1: List All The List all menu option will search the grade book for the matching student and display on the console, the three exam scores. Create a function called list_exams to use to perform the search and output for this menu option. [ If the search does not result in a student id match, the program should indicate that the student id provided was not found. Not Found: provided_student_id Submenu 2: Average The Average menu option will search the grade book for the matching student and display on the console, the average value for the three exams. Create a function called cal_ave to provide the average exam results. The results will be displayed on the console (floating point with two decimals). Student Average: NN.NN If the search does not result in a student id match, the program should indicate that the student id provided was not found. Not Found: provided_student_id Submenu 3: Low Score The Low Score menu option will search the grade book for the matching student and display on the console, the student's lowest exam score. Create a function called cal_low to provide the lowest exam results for the student. The results will be displayed on the console. Low Score: NNN If the search does not result in a student id match, the program should indicate that the student id provided was not found. Not Found: provided_student_id Submenu 4: High Score The High Score menu option will search the grade book for the matching student and display on the console, the student's highest exam score. Create a function called cal_high to provide the highest exam score for the student. The results will be displayed on the console. If the search does not result in a student id match, the program should indicate that the student id provided was not found. Not Found: provided_student_id Submenu 5: Exit This option should return the user to the main menu. Main Menu 2: Graphs The Graphs menu option will provide a console display to indicate the results will be a graph of the exam scores. This will provide a graph of exam scores. It will also search the grade book for the matching student. The user will need to provide the student abc 123. Provide abc123 of Student: If the search does not result in a student id match, the program should indicate that the student id provided was not found. Not Found: provided_student_id When a student is found, a plot of the students scores will be displayed in the console. The plot must include each of the three scores, clearly labeled. It must include a label for the x axis ("Exams") and a label for the y label ("Scores") and a legend with the student's abc123. Below is an example of the appropriate format. Once the plot is completed the program returns to the main menu. Main Menu 3: Class Graph (Extra Credit) This menu option is extra credit if you complete it ( 25pts ). If you do not want to submit extra credit, display the following prompt when the user selects option 3 . And return the user to the main menu. The "Under Construction" option does not get you any additional extra credit points Under Construction To get full extra credit points, when the user selects option 3, the program will first calculate the overall average grade for each student. Then, it will determine each individual students letter grade. Letter grades are based on the ranges listed in the table below. Then the program will create a plot with the number of students in each category. The plot must include the letter grades on the x axis and the number of students on the y axis with approprate labels. You must also include a title "Report of Section 1 Grades". The example below only has three scores and they were all As. This is just an example, the real data will be different but the x and y axis format will be the same. Main Menu 4: Output Grades File When the instructor/user selects option 4, the program will create an output text file. The text file will include one line for each student in the master list. The format of the output will be Last Name, First Name and the student's Average Score. The file will also include a coma between each field in the output. The name of the file to output will be "Section1Results.txt". The display will notify the user that the file has been created. Main Menu 5: Exit When the instructor/user selects option 5, the program will display the below farewell message on the console. Include your name in YOURNAME> Thank you. This program is brought to you by Python Expert: YOURNAME. Test Script When we evaluate your program, we will start with this test script to see if you have all of the functions and capabilities required in the minimum requirements. We may use additional menu choices, but if your program can successfully navigate the below script and provide the required information you should get full points (based on the rubric). 1, 1, abc123, 2, aaa123, 3, zzz123, 3, ccc123, 4, iii123, 5, 2, abc 123,2 , iii123, 3, 4, 5 \begin{tabular}{|l|l|l|r|r|r|} \hline abc123 & Linda & Smith & 100 & 75 & 100 \\ \hline abc222 & Tom & Seaver & 100 & 100 & 100 \\ \hline abc333 & Mary & Rogers & 75 & 100 & 100 \\ \hline abc444 & Kathy & Garza & 30 & 60 & 75 \\ \hline abc555 & Cheyenne & Kelly & 75 & 80 & 82 \\ \hline abc666 & Moses & Gibbs & 80 & 75 & 60 \\ \hline abc777 & Odai & Link & 60 & 88 & 75 \\ \hline abc888 & Mario & Holland & 96 & 100 & 93 \\ \hline abc999 & Anna & Martinez & 100 & 65 & 88 \\ \hline abc111 & Jonathan & Lopez & 85 & 70 & 72 \\ \hline abc122 & Ashley & Salas & 70 & 80 & 85 \\ \hline abc132 & Nathan & Valdez & 80 & 65 & 88 \\ \hline aaa123 & Daniel & Walsh & 90 & 88 & 78 \\ \hline bbb123 & Max & Sweeney & 95 & 65 & 99 \\ \hline ccc123 & Elliott & Bilek & 50 & 75 & 100 \\ \hline ddd123 & Nicole & lbarra & 65 & 80 & 77 \\ \hline eee123 & Alec & Rosales & 80 & 88 & 83 \\ \hline fff123 & Maddie & Martin & 90 & 65 & 87 \\ \hline ggg123 & Fernanda & Ngo & 45 & 80 & 55 \\ \hline hhm123 & Cali & Castillio & 0 & 75 & 88 \\ \hline Jared & Whillip & Olsodard & 75 & 55 & 87 \\ \hline \end{tabular}
Step by Step Solution
There are 3 Steps involved in it

Get step-by-step solutions from verified subject matter experts


