

Answered step by step
Verified Expert Solution
Question
1 Approved Answer
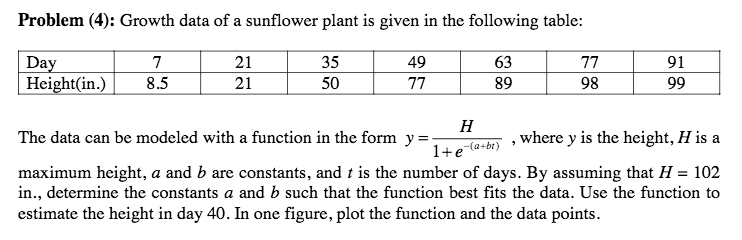
do on matlab Problem ( 4 ) : Growth data of a sunflower plant is given in the following table: The data can be modeled
do on matlab
Problem : Growth data of a sunflower plant is given in the following table:
The data can be modeled with a function in the form where is the height, is a
maximum height, a and are constants, and is the number of days. By assuming that
in determine the constants a and such that the function best fits the data. Use the function to
estimate the height in day In one figure, plot the function and the data points.
Using subplots, create two plots with one on the left and the other on the right. On the left, the data and the fit should be shown as straight lines. On the right, plot height vs day.
Step by Step Solution
There are 3 Steps involved in it
Step: 1

Get Instant Access to Expert-Tailored Solutions
See step-by-step solutions with expert insights and AI powered tools for academic success
Step: 2

Step: 3
Ace Your Homework with AI
Get the answers you need in no time with our AI-driven, step-by-step assistance
Get Started
Transact SQL Cookbook Help For Database Programmers
Authors: Ales Spetic, Jonathan Gennick
1st Edition
1565927567, 978-1565927568