

Answered step by step
Verified Expert Solution
Question
1 Approved Answer
Draw a Gantt chart for Q1 and Q2 and Q3. Only draw Gantt chart 1. Draw a Gantt chart and find the average waiting time
Draw a Gantt chart for Q1 and Q2 and Q3. Only draw Gantt chart
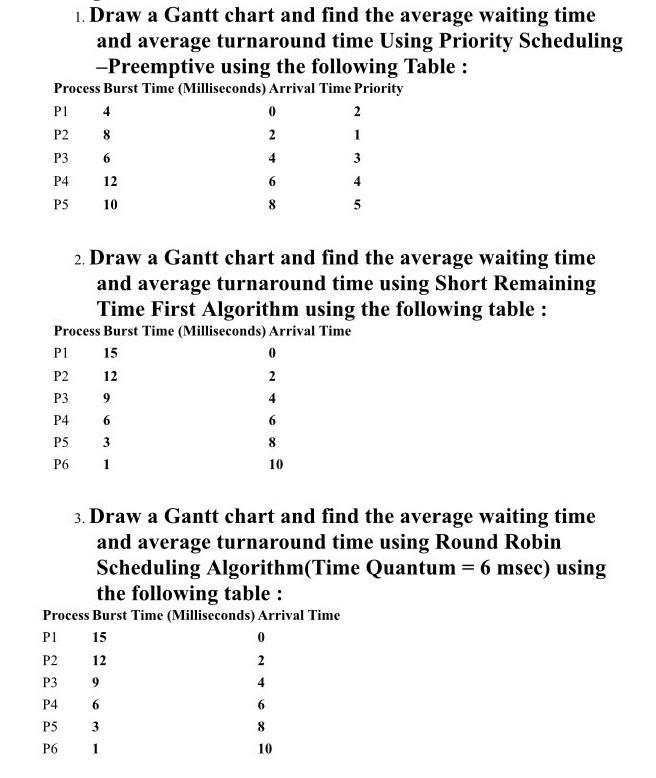
1. Draw a Gantt chart and find the average waiting time and average turnaround time Using Priority Scheduling -Preemptive using the following Table : 2. Draw a Gantt chart and find the average waiting time and average turnaround time using Short Remaining Time First Algorithm using the following table : 3. Draw a Gantt chart and find the average waiting time and average turnaround time using Round Robin Scheduling Algorithm(Time Quantum =6msec ) using the following tableStep by Step Solution
There are 3 Steps involved in it
Step: 1

Get Instant Access to Expert-Tailored Solutions
See step-by-step solutions with expert insights and AI powered tools for academic success
Step: 2

Step: 3
Ace Your Homework with AI
Get the answers you need in no time with our AI-driven, step-by-step assistance
Get Started
Oracle Database 12c Dba Handbook Manage A Scalable Secure Oracle Enterprise Database Environment
Authors: Bob Bryla
1st Edition
0071798781, 978-0071798785