Answered step by step
Verified Expert Solution
Question
1 Approved Answer
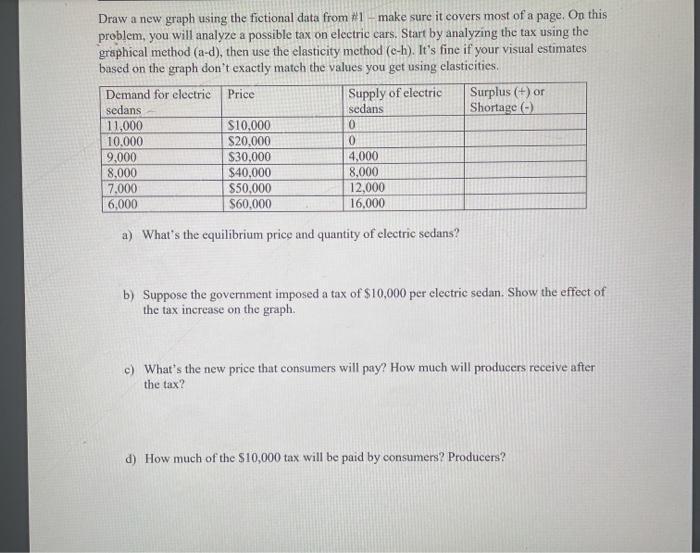
Draw a new graph using the fictional data from #1 make sure it covers most of a page. On this problem, you will analyze

Draw a new graph using the fictional data from #1 make sure it covers most of a page. On this problem, you will analyze a possible tax on electric cars. Start by analyzing the tax using the graphical method (a-d), then use the elasticity method (e-h). It's fine if your visual estimates based on the graph don't exactly match the values you get using elasticities. Demand for electric Price Supply of electric sedans sedans 11,000 $10,000 0 10,000 $20,000 0 9,000 $30,000 4,000 8,000 $40,000 8,000 7,000 $50,000 12,000 6,000 $60,000 16,000 Surplus (+) or Shortage (-) a) What's the equilibrium price and quantity of electric sedans? b) Suppose the government imposed a tax of $10,000 per electric sedan. Show the effect of the tax increase on the graph. c) What's the new price that consumers will pay? How much will producers receive after the tax? d) How much of the $10,000 tax will be paid by consumers? Producers?
Step by Step Solution
There are 3 Steps involved in it
Step: 1

Get Instant Access to Expert-Tailored Solutions
See step-by-step solutions with expert insights and AI powered tools for academic success
Step: 2

Step: 3

Ace Your Homework with AI
Get the answers you need in no time with our AI-driven, step-by-step assistance
Get Started


