Answered step by step
Verified Expert Solution
Link Copied!

Question

1 Approved Answer

Draw time lines for (1) a $200 lump sum cash flow at the end of Year 2; (2) an ordinary annuity of $200 per year
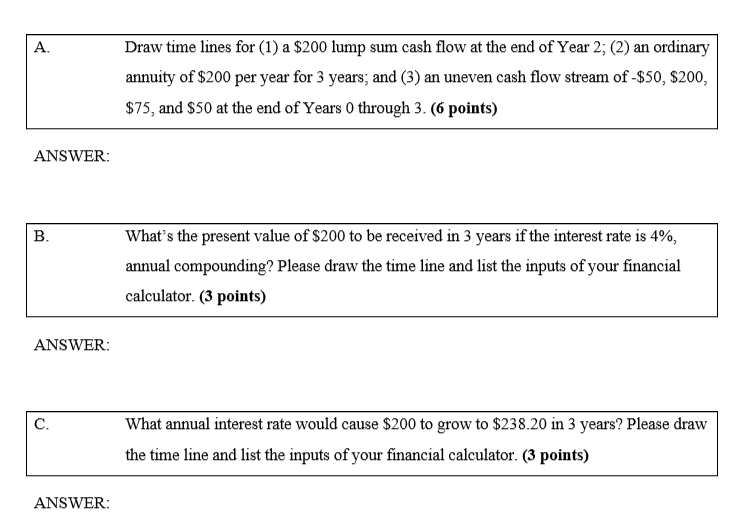
image text in transcribed

Draw time lines for (1) a $200 lump sum cash flow at the end of Year 2; (2) an ordinary annuity of $200 per year for 3 years; and (3) an uneven cash flow stream of -S50, $200, $75, and S50 at the end of Years 0 through 3. (6 points) A. ANSWER What's the present value of $200 to be received in 3 years if the interest rate is 4%, annual compounding? Please draw the time line and list the inputs of your financial calculator. (3 points) B. ANSWER What annual interest rate would cause $200 to grow to $238.20 in 3 years? Please dravw the time line and list the inputs of your financial calculator. (3 points) C

Step by Step Solution

There are 3 Steps involved in it

Step: 1

blur-text-image

Get Instant Access to Expert-Tailored Solutions

See step-by-step solutions with expert insights and AI powered tools for academic success

Step: 2

blur-text-image

Step: 3

blur-text-image

Ace Your Homework with AI

Get the answers you need in no time with our AI-driven, step-by-step assistance

Get Started

Students also viewed these Finance questions

Question

Which month has the lowest average percentage of returned sales?

Answered: 1 week ago

Question

What is the average percentage of returned sales for Oklahoma (OK)?

Answered: 1 week ago