Answered step by step
Verified Expert Solution
Link Copied!

Question

1 Approved Answer

E Homework: 2.3 Question 17, 2.3.97 Use a stem-and-leaf plot to display the data. The data represent the heights of eruptions by a geyser. 100
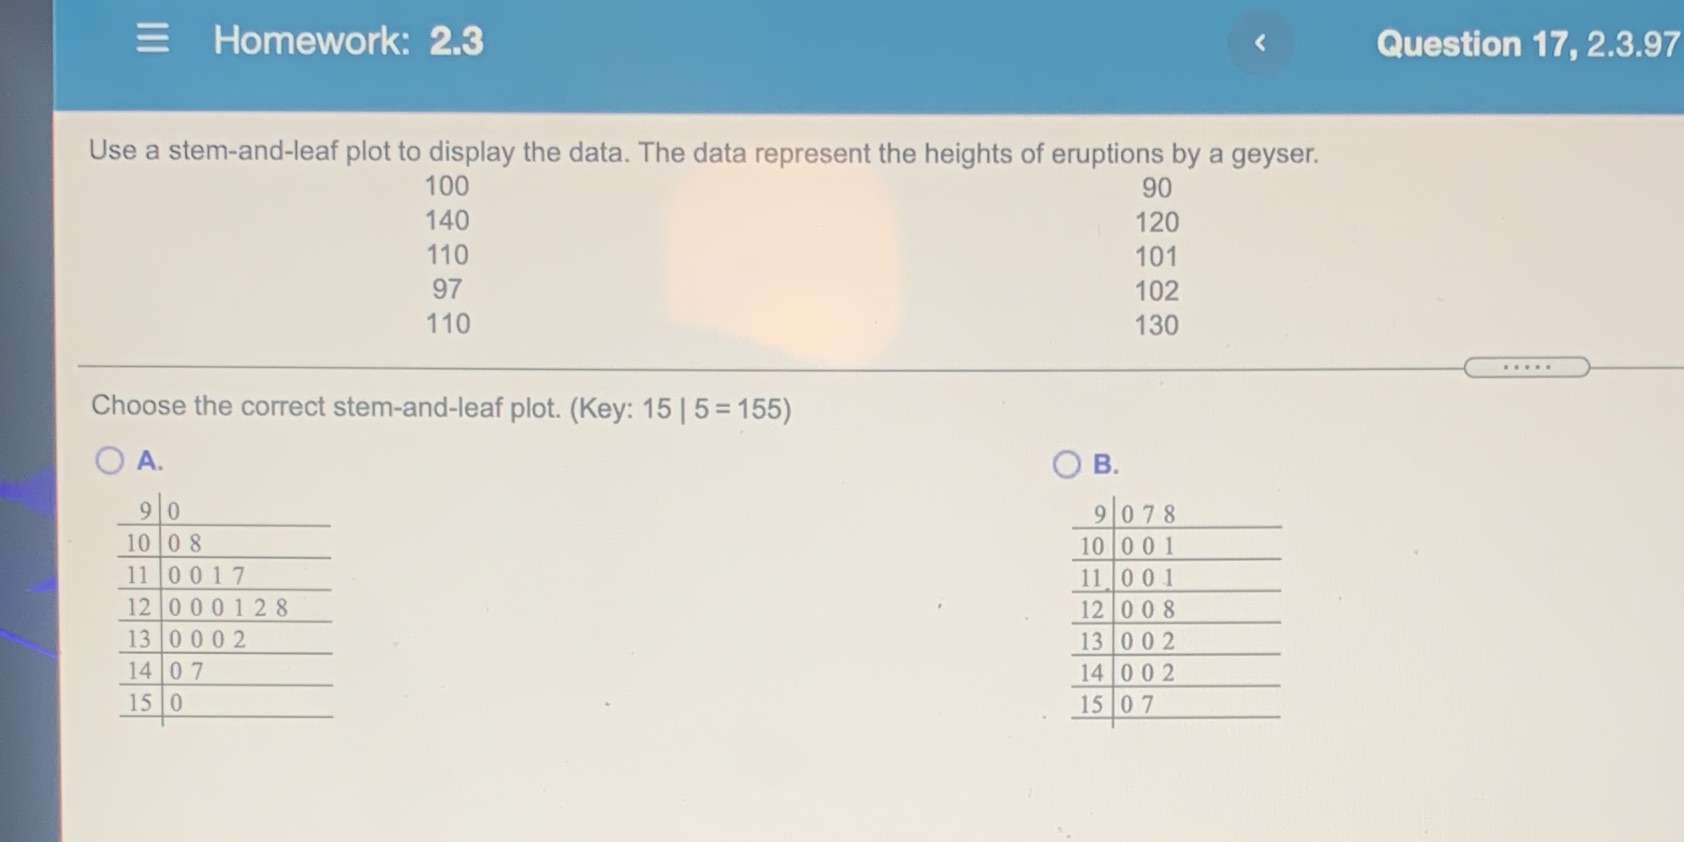
image text in transcribed
E Homework: 2.3 Question 17, 2.3.97 Use a stem-and-leaf plot to display the data. The data represent the heights of eruptions by a geyser. 100 90 140 120 110 101 97 102 110 130 . . . . . Choose the correct stem-and-leaf plot. (Key: 15 | 5 = 155) O A. O B. 90 9/07 8 10 08 10 0 01 11 0 017 11 0 01 12 0 0 0128 12 0 0 8 13 0 002 13 0 02 14 07 14 0 02 15 0 15 07

Step by Step Solution

There are 3 Steps involved in it

Step: 1

blur-text-image

Get Instant Access to Expert-Tailored Solutions

See step-by-step solutions with expert insights and AI powered tools for academic success

Step: 2

blur-text-image

Step: 3

blur-text-image

Ace Your Homework with AI

Get the answers you need in no time with our AI-driven, step-by-step assistance

Get Started

Recommended Textbook for

Applied Calculus

Authors: Stefan Waner, Steven Costenoble

7th Edition

1337514306, 9781337514309

More Books

Students also viewed these Mathematics questions

Question

How has technology had an impact on aggregate planning?

Answered: 1 week ago