Question
Every year, a massive amount of data is collected on a variety of issues related to the development status of countries and regions around the
Every year, a massive amount of data is collected on a variety of issues related to the development status of countries and regions around the world. This data includes statistics on rural and urban development, agriculture, health, and infrastructure. Careful analysis of this data can reveal trends that can be used to direct efforts to improve the status of a given country or area.
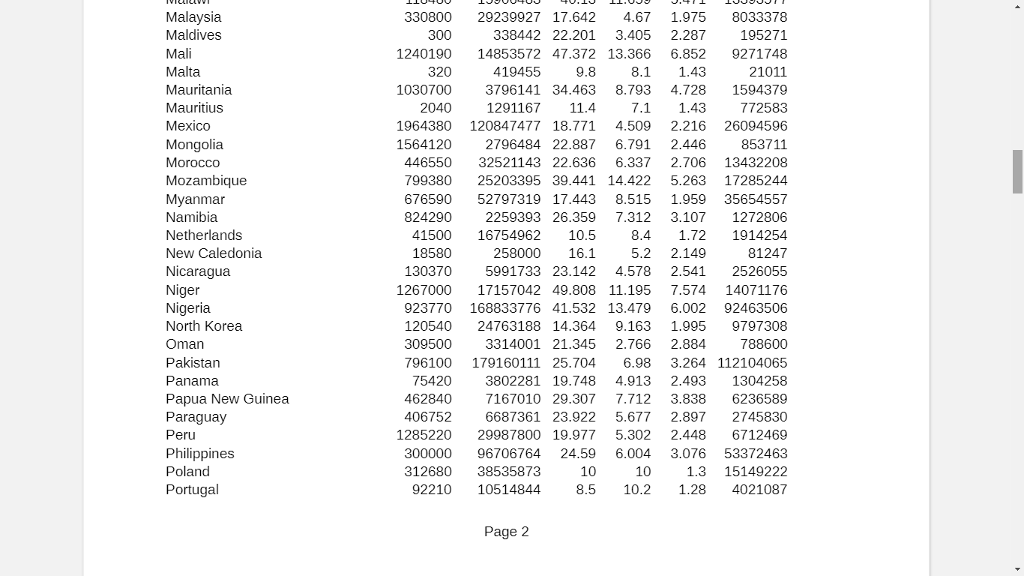
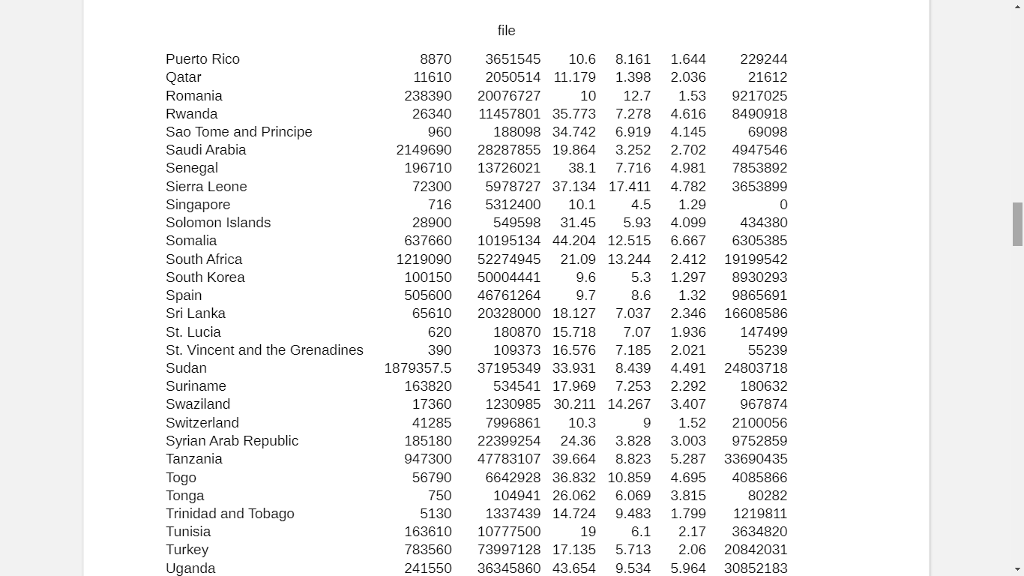
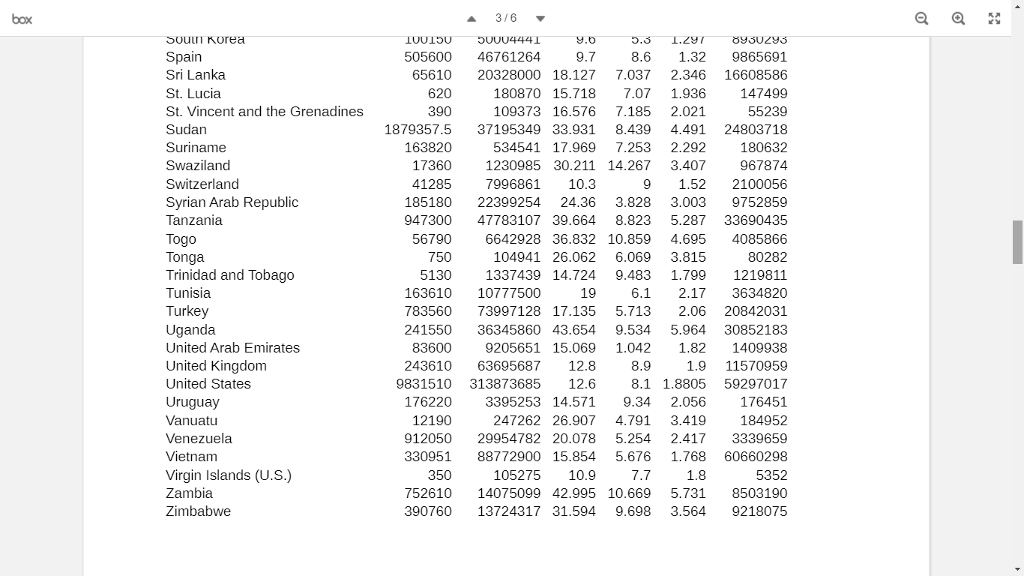
For this assignment, your program will read, organize and analyze real-world data for various countries around the world. The data you will process was collected for the year 2013 and comes from the World Bank (source: https:/db.nal.usda.gov/).
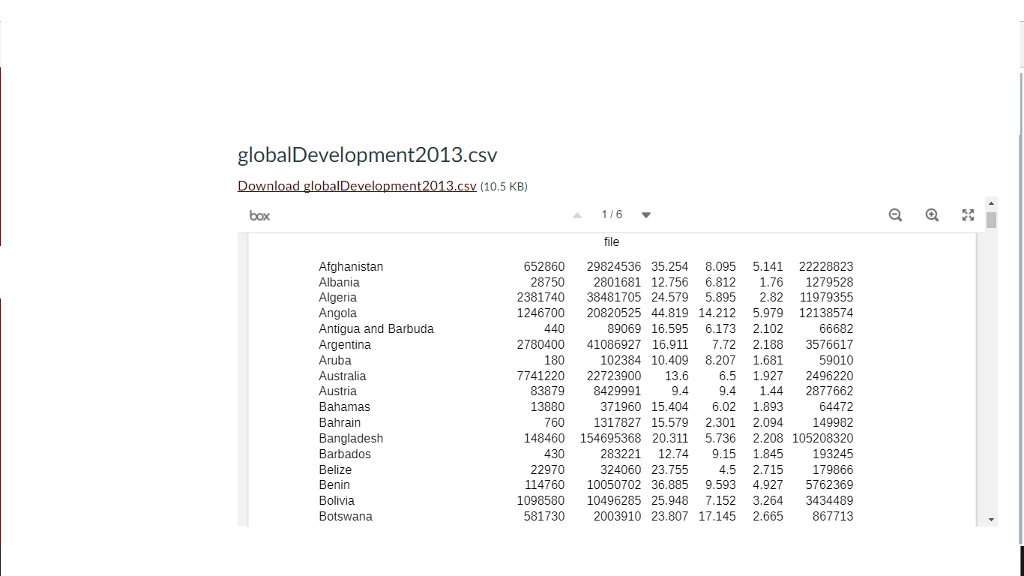
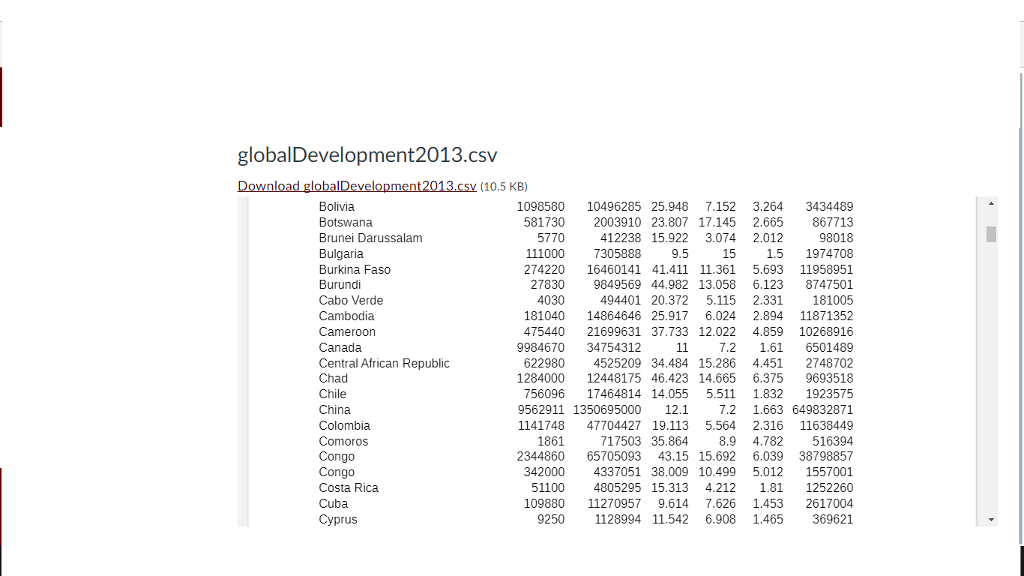
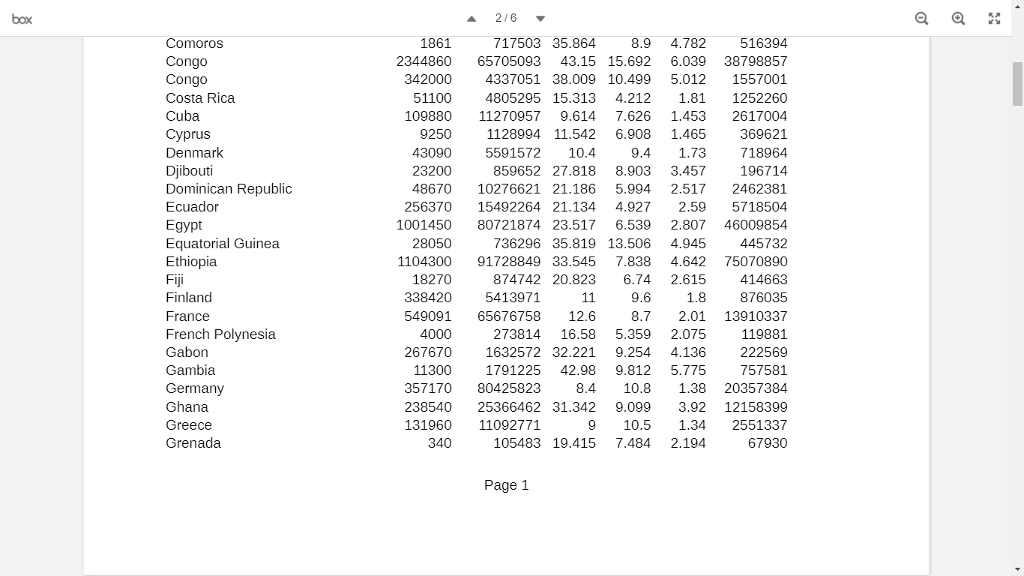
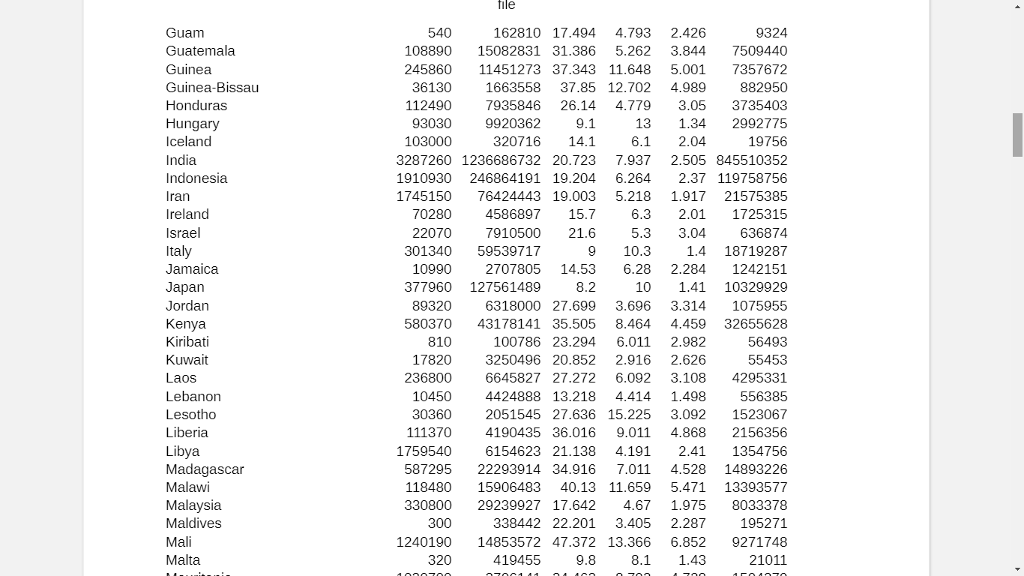
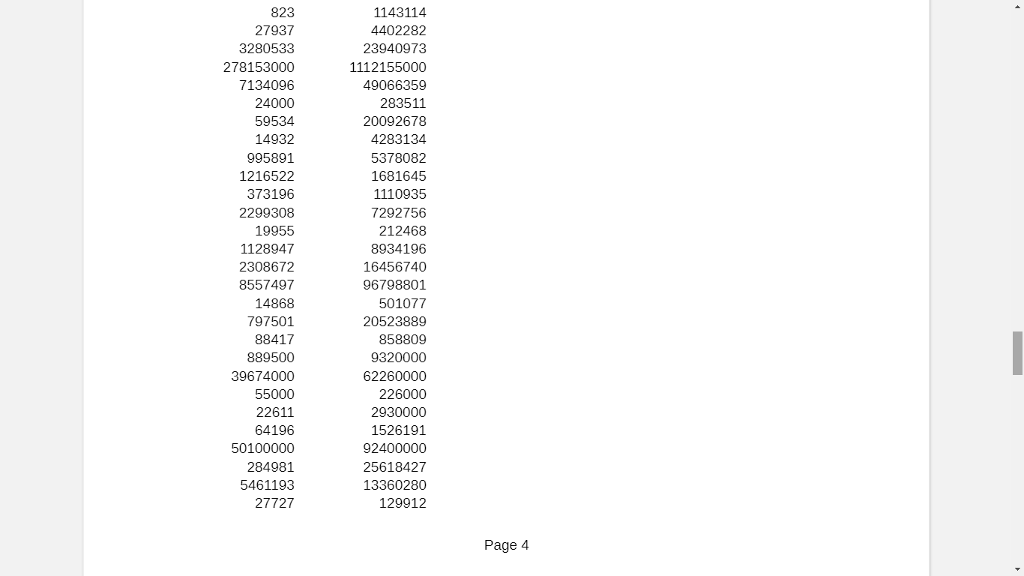
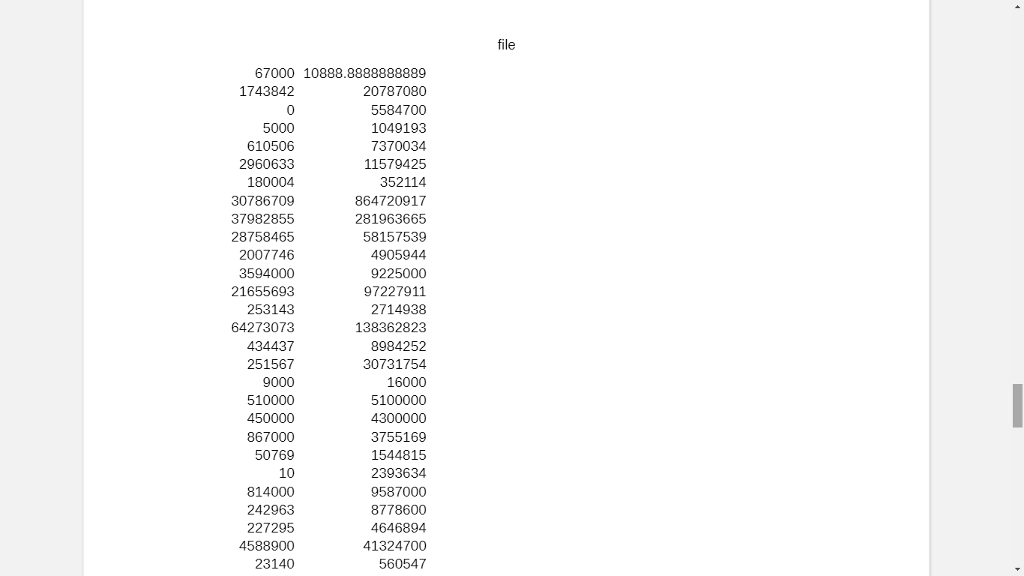
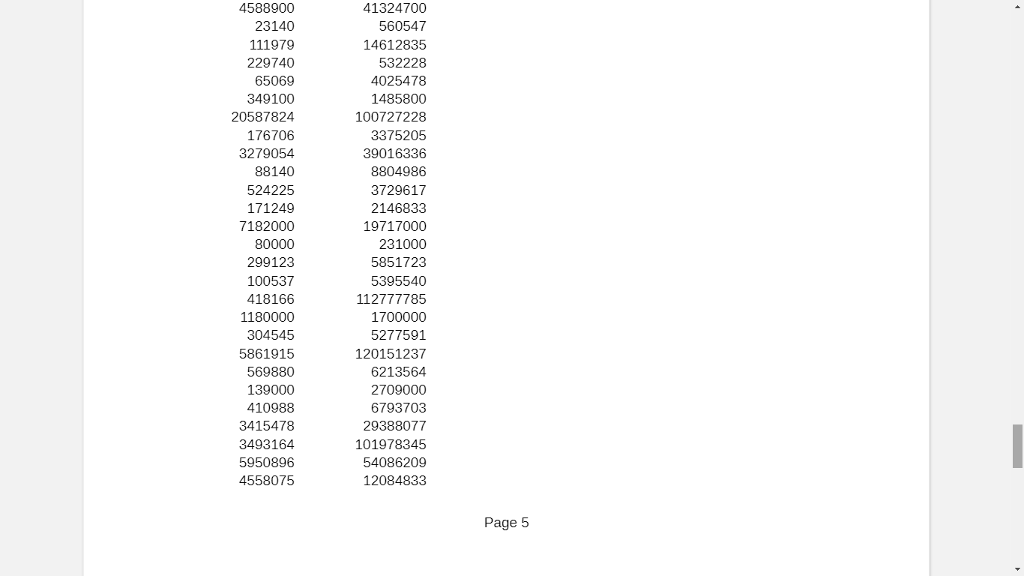
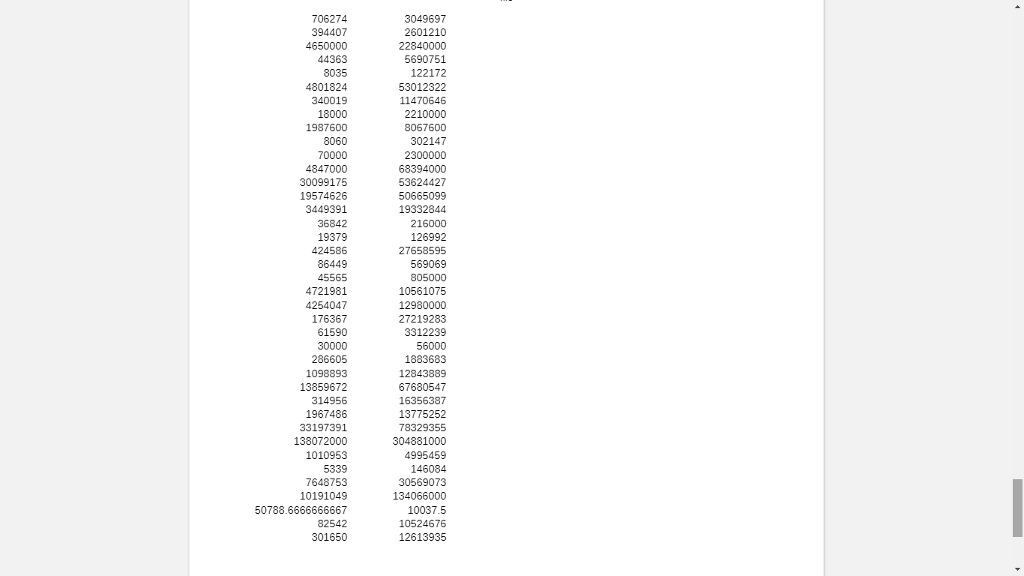
Download the input data file using the following link: globalDevelopment2013.csv
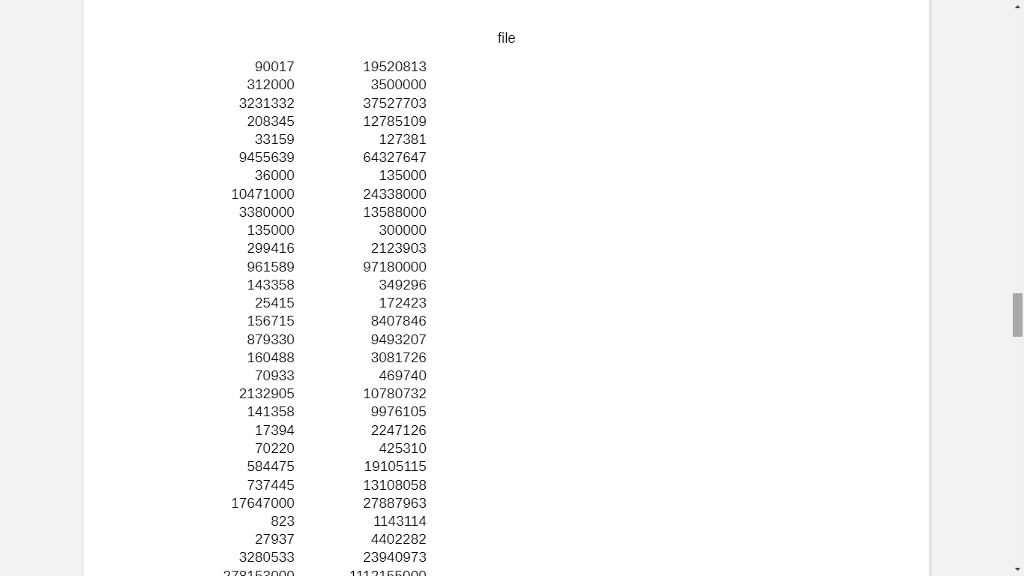
 . Open the file in a text editor (PC users should use WordPad instead of NotePad). Each line contains the following data in this order:
Country Name
Surface Area (in square kilometers)
Total Population
Birth Rate (per 1000 people)
Death Rate (per 1000 people)
Fertility Rate
Rural Population
Telephone Lines
Mobile Phone Subscriptions
The extension on the data file is csv, which stands for comma separated values. The values on each line are separated by a single comma.
The country name should be read as a character string. All other data can be read as double values.
Design and Program Behavior
Create a new BlueJ project called Project3. Inside that project create a class called CountryAnalyzer. The main method in this class will read the data file, perform the analysis, and produce the output.
To assist in the analysis, create a class call Country that represents a single country. The fields (instance data) in the Country class will store all of the data for one country. The Country constructor should accept parameters for all fields in the order listed above.
In the main method, create an ArrayList that stores Country objects. Then use a while loop to read and store the input data. Each time through the loop, read the data on one line, create a Country object, and add that object to the array list.
Because the input file is a CSV file, set up the Scanner object to use commas and new line characters as the delimiters:
inFile.useDelimiter(",| "); In the Country class, create the following methods to help perform the needed analysis:
toString - The standard toString method should return a string containing the country name followed by the total population in parentheses.
getFertilityRate - A standard getter for the fertility rate of the country.
getTelephoneLines - A standard getter for the number of telephone lines in the country.
getPopulationDensity - This method computes and returns the population density for the country, which is the number of people per square kilometer of area.
getUrbanRatio - This method computes and returns the urban ratio, which is the urban population over the total population. Since the input data doesn't contain the urban population explicitly, you will first have to calculate it by subtracting the rural population from the total population.
getPopulationChange - This method computes and returns the population change, defined as the birth rate minus the death rate.
getMobileRatio - This method computes and returns the ratio of the number of mobile phone subscriptions to the total population.
None of these methods accept parameters. The data they need to perform the analysis is already stored as (or can be derived from) instance data in the Country object.
In the main method, after creating the array list of Country objects, use a for-each loop to print information for each country as shown in this sample:
Honduras (Population: 7935846.0) Population Density: 70.5 Percent Urban: 52.9% Hungary (Population: 9920362.0) Population Density: 106.6 Percent Urban: 69.8% POPULATION DECLINE Iceland (Population: 320716.0) Population Density: 3.1 Percent Urban: 93.8%
The indentation under each country can be accomplished by printing a \t (horizontal tab) character before the output. When needed, use printf statements to print all values to 1 digit past the decimal point.
Note that the while the getUrbanRatio returns a ratio, the result should be printed as a percentage.
If the population change for a country is negative, the output should contain an extra line of output stating POPULATION DECLINE (as is true for Hungary in the sample above). If the population change is positive, which is most often the case, no output should be printed.
Finally, after producing the output for all countries, print the country with the lowest mobile phone ratio, as shown here:
Zambia (Population: 1.4075099E7) Population Density: 18.7 Percent Urban: 39.6% Zimbabwe (Population: 1.3724317E7) Population Density: 35.1 Percent Urban: 32.8% Country with the lowest mobile phone ratio: Guam (Population: 162810.0) Mobile phone percentage: 6.7%
Note that, as with the urban ratio, the mobile phone data should be presented as a percentage.
Developing the Program
As always, develop your program in stages. Don't try to get the whole thing written before compiling and testing it. For example, make sure you're reading the data correctly before writing all of the analysis methods. Then do each analysis step separately, checking your calculations carefully.
Remember to include JavaDoc comments for the class and each method in all classes. Include all appropriate tags. Update the comments as needed as you refine your program.
And remember that a working program is not necessarily a good program. Always look for opportunities to improve your code. Have you picked meaningful variable names? Is there unnecessary logic that can be eliminated? Are you doing things inside loops that you don't have to do each time? Are your comments accurate and helpful?
Step by Step Solution
There are 3 Steps involved in it
Step: 1

Get Instant Access to Expert-Tailored Solutions
See step-by-step solutions with expert insights and AI powered tools for academic success
Step: 2

Step: 3

Ace Your Homework with AI
Get the answers you need in no time with our AI-driven, step-by-step assistance
Get Started


