Answered step by step
Verified Expert Solution
Question
1 Approved Answer
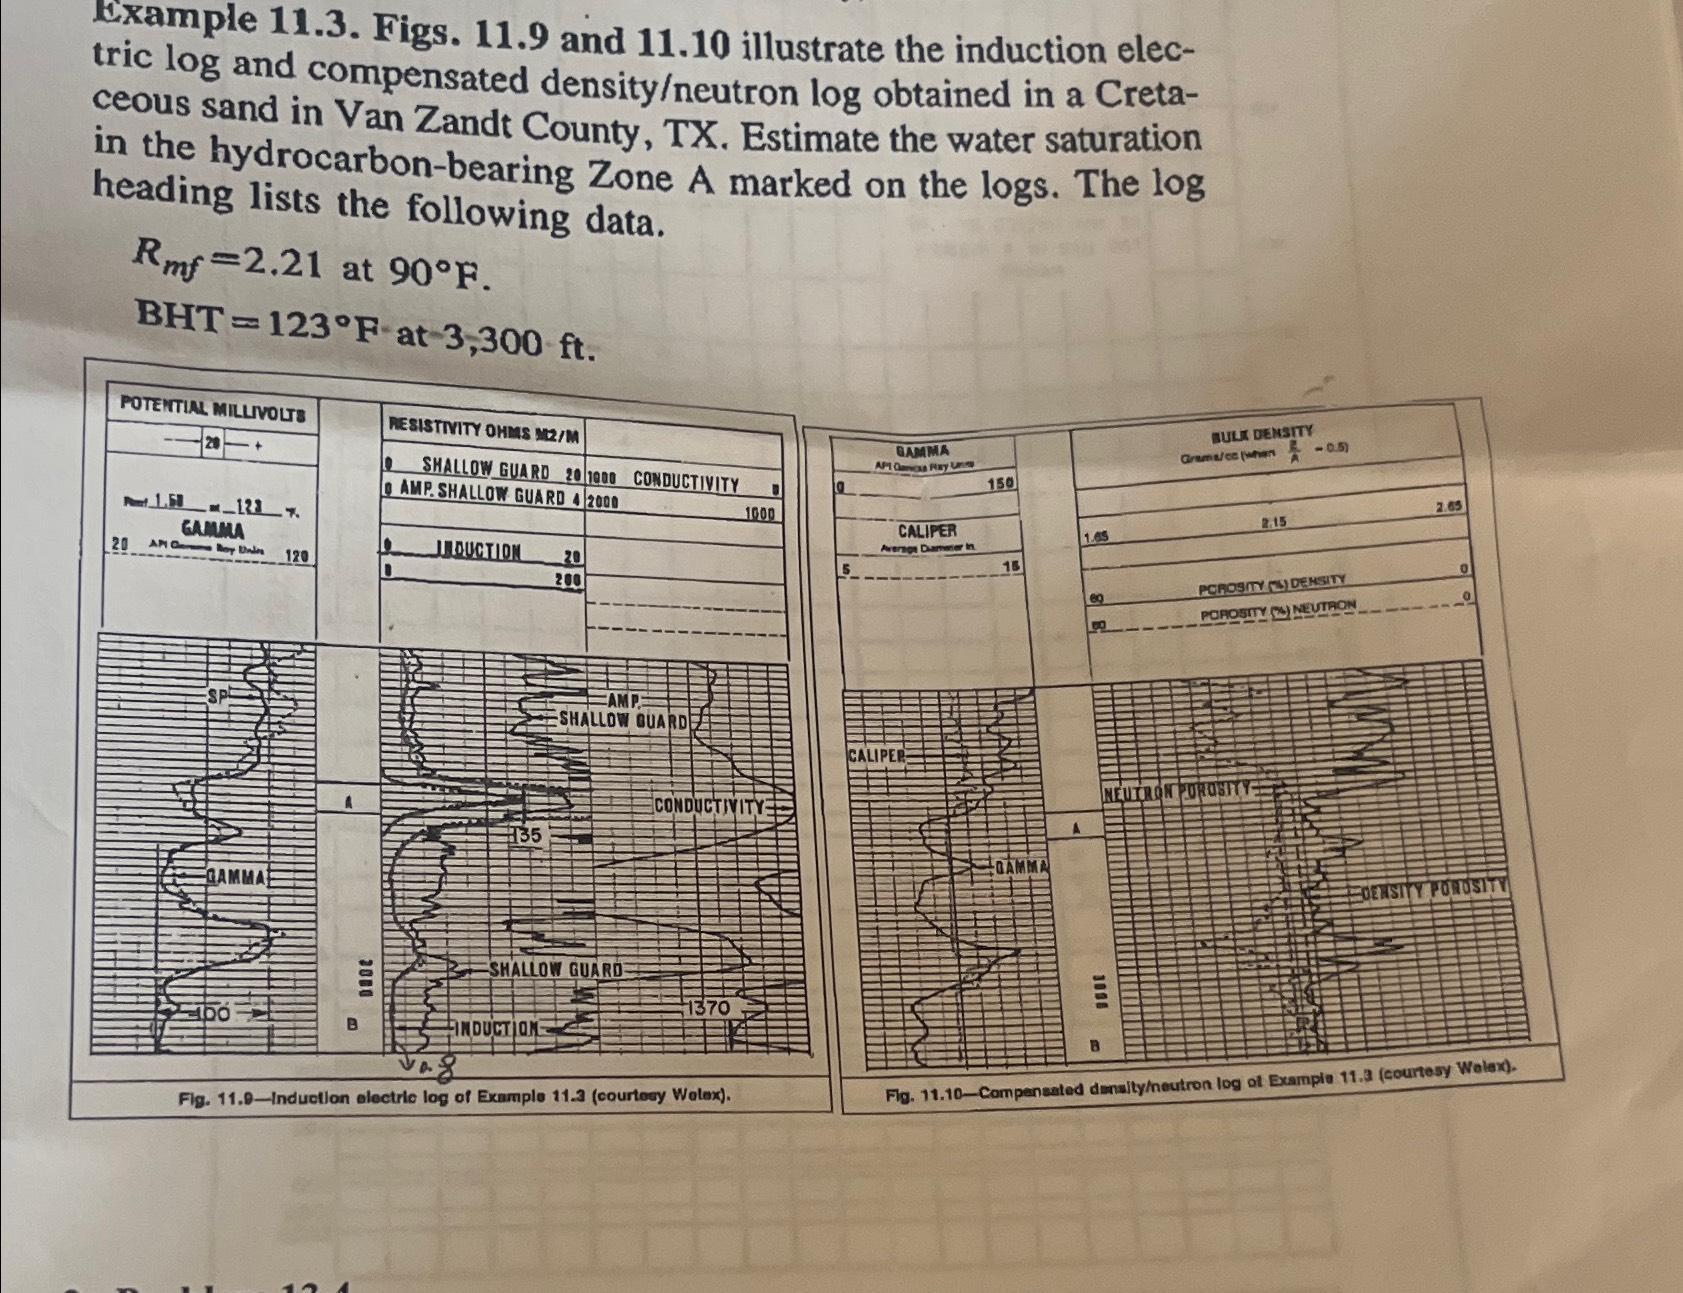
Example 11.3. Figs. 11.9 and 11.10 illustrate the induction elec- tric log and compensated density/neutron log obtained in a Creta- ceous sand in Van

Example 11.3. Figs. 11.9 and 11.10 illustrate the induction elec- tric log and compensated density/neutron log obtained in a Creta- ceous sand in Van Zandt County, TX. Estimate the water saturation in the hydrocarbon-bearing Zone A marked on the logs. The log heading lists the following data. Rmf=2.21 at 90F. BHT=123F at 3,300 ft. POTENTIAL MILLIVOLTS RESISTIVITY OHMS M2/M 20 SHALLOW GUARD 20/1900 CONDUCTIVITY AMP. SHALLOW GUARD 4 2000 1000 Pt1.50 123% GAMMA 20 AP Com Boy Uni 120 INDUCTION 20 200 GAMMA 100 2080 AMP SHALLOW GUARDE GAMMA API Ganca Ray Un 150 BULK DENSITY Grama/ce (when-0.5) CALIPER Average Diameter in 2.15 1.65 5 15 eQ POROSITY) DENSITY POROSITY NEUTRON CALIPER CONDUCTIVITY 135 SHALLOW GUARD 1370 INDUCTION Fig. 11.9-Induction electric log of Example 11.3 (courtesy Wolex). DAMMA NEUTRON POROSITY: 1000 2.65 OERSITY POROSIT Fig. 11.10-Compensated density/neutron log of Example 11.3 (courtesy Walex).
Step by Step Solution
There are 3 Steps involved in it
Step: 1

Get Instant Access to Expert-Tailored Solutions
See step-by-step solutions with expert insights and AI powered tools for academic success
Step: 2

Step: 3

Ace Your Homework with AI
Get the answers you need in no time with our AI-driven, step-by-step assistance
Get Started


