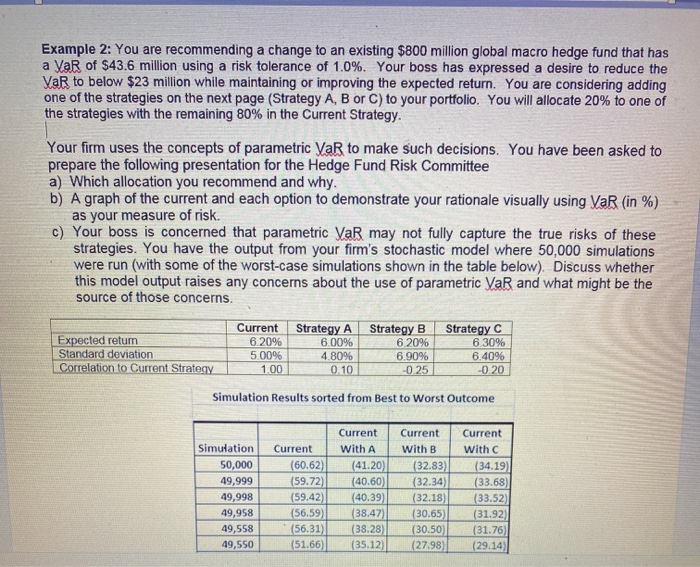
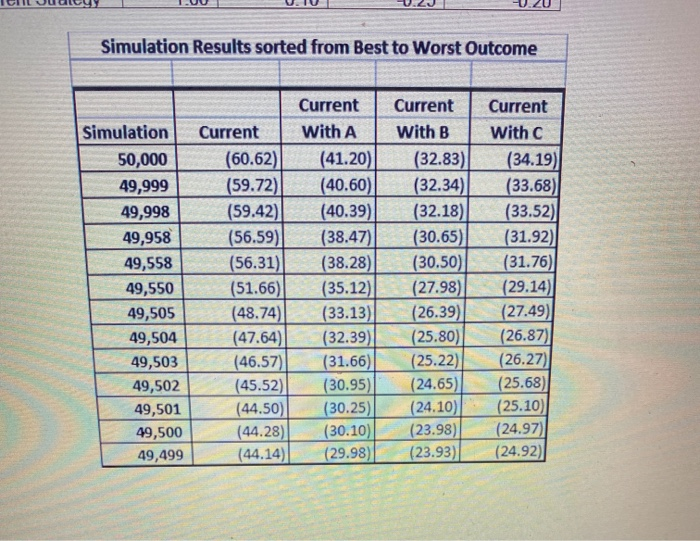
Example 2: You are recommending a change to an existing $800 million global macro hedge fund that has a VaR of $43.6 million using a risk tolerance of 1.0%. Your boss has expressed a desire to reduce the VaR to below $23 million while maintaining or improving the expected return. You are considering adding one of the strategies on the next page (Strategy A, B or C) to your portfolio. You will allocate 20% to one of the strategies with the remaining 80% in the Current Strategy. Your firm uses the concepts of parametric VaR to make such decisions. You have been asked to prepare the following presentation for the Hedge Fund Risk Committee a) Which allocation you recommend and why. b) A graph of the current and each option to demonstrate your rationale visually using VaR (in %) as your measure of risk. c) Your boss is concerned that parametric VaR may not fully capture the true risks of these strategies. You have the output from your firm's stochastic model where 50,000 simulations were run (with some of the worst-case simulations shown in the table below). Discuss whether this model output raises any concerns about the use of parametric VaR and what might be the source of those concerns. Expected retum Standard deviation Correlation to Current Strategy Current 6.20% 500% 1.00 Strategy A 6.00% 4.80% 0.10 Strategy B 6.20% 6.90% -0.25 Strategy C 6.30% 6.40% -0.20 Simulation Results sorted from Best to Worst Outcome Simulation 50,000 49,999 49,998 49,958 49,558 49,550 Current (60.62) (59.72) (59.42) (56.59) (56.31) (51.66) Current With A (41.20 (40.60) (40.39 (38.47) (38.28) (35.12) Current with B (32.83) (32.34) (32.18) (30.65 (30.50 (27.98) Current With (34.19 (33.68 (33.52) (31.92) (31.76) (29.14) Simulation Results sorted from Best to Worst Outcome Simulation 50,000 49,999 49,998 49,958 49,558 49,550 49,505 49,504 49,503 49,502 49,501 49,500 49,499 Current (60.62) (59.72) (59.42) (56.59) (56.31) (51.66) (48.74) (47.64) (46.57) (45.52) (44.50) (44.28) (44.14) Current With A (41.20) (40.60) (40.39) (38.47) (38.28) (35.12) (33.13) (32.39) (31.66) (30.95) (30.25) (30.10) (29.98) Current with B (32.83) (32.34) (32.18) (30.65) (30.50) (27.98) (26.39) (25.80) (25.22) (24.65) (24.10) (23.98) (23.93) Current with C (34.19) (33.68) (33.52) (31.92) (31.76) (29.14) (27.49) (26.87) (26.27) (25.68) (25.10) (24.97) (24.92) Example 2: You are recommending a change to an existing $800 million global macro hedge fund that has a VaR of $43.6 million using a risk tolerance of 1.0%. Your boss has expressed a desire to reduce the VaR to below $23 million while maintaining or improving the expected return. You are considering adding one of the strategies on the next page (Strategy A, B or C) to your portfolio. You will allocate 20% to one of the strategies with the remaining 80% in the Current Strategy. Your firm uses the concepts of parametric VaR to make such decisions. You have been asked to prepare the following presentation for the Hedge Fund Risk Committee a) Which allocation you recommend and why. b) A graph of the current and each option to demonstrate your rationale visually using VaR (in %) as your measure of risk. c) Your boss is concerned that parametric VaR may not fully capture the true risks of these strategies. You have the output from your firm's stochastic model where 50,000 simulations were run (with some of the worst-case simulations shown in the table below). Discuss whether this model output raises any concerns about the use of parametric VaR and what might be the source of those concerns. Expected retum Standard deviation Correlation to Current Strategy Current 6.20% 500% 1.00 Strategy A 6.00% 4.80% 0.10 Strategy B 6.20% 6.90% -0.25 Strategy C 6.30% 6.40% -0.20 Simulation Results sorted from Best to Worst Outcome Simulation 50,000 49,999 49,998 49,958 49,558 49,550 Current (60.62) (59.72) (59.42) (56.59) (56.31) (51.66) Current With A (41.20 (40.60) (40.39 (38.47) (38.28) (35.12) Current with B (32.83) (32.34) (32.18) (30.65 (30.50 (27.98) Current With (34.19 (33.68 (33.52) (31.92) (31.76) (29.14) Simulation Results sorted from Best to Worst Outcome Simulation 50,000 49,999 49,998 49,958 49,558 49,550 49,505 49,504 49,503 49,502 49,501 49,500 49,499 Current (60.62) (59.72) (59.42) (56.59) (56.31) (51.66) (48.74) (47.64) (46.57) (45.52) (44.50) (44.28) (44.14) Current With A (41.20) (40.60) (40.39) (38.47) (38.28) (35.12) (33.13) (32.39) (31.66) (30.95) (30.25) (30.10) (29.98) Current with B (32.83) (32.34) (32.18) (30.65) (30.50) (27.98) (26.39) (25.80) (25.22) (24.65) (24.10) (23.98) (23.93) Current with C (34.19) (33.68) (33.52) (31.92) (31.76) (29.14) (27.49) (26.87) (26.27) (25.68) (25.10) (24.97) (24.92)