Answered step by step
Verified Expert Solution
Question
1 Approved Answer
Example 3.4 Recall the Verizon case study in Section 1.3. Whether Verizon is judged to be making repairs slower for competitors' customers is determined


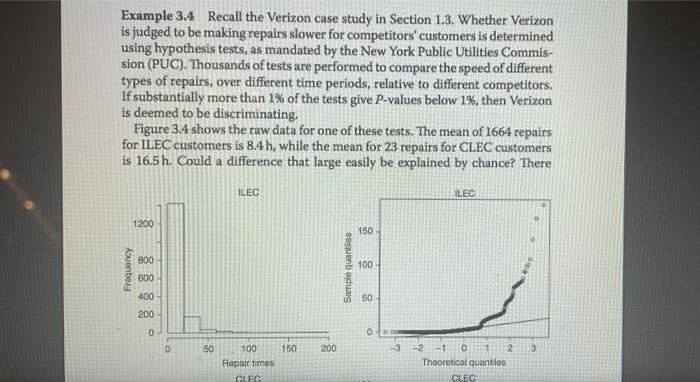
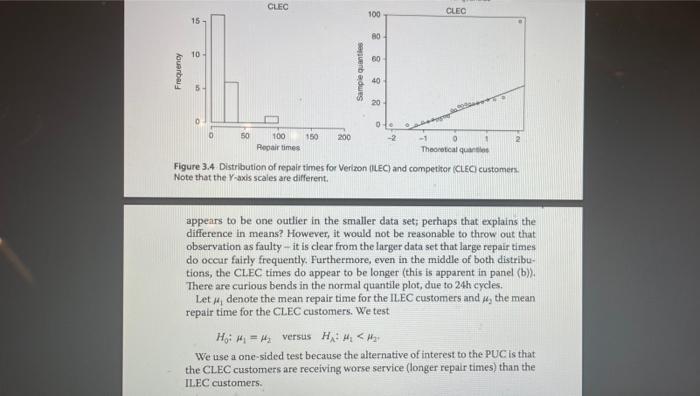
Example 3.4 Recall the Verizon case study in Section 1.3. Whether Verizon is judged to be making repairs slower for competitors' customers is determined using hypothesis tests, as mandated by the New York Public Utilities Commis- sion (PUC). Thousands of tests are performed to compare the speed of different types of repairs, over different time periods, relative to different competitors. If substantially more than 1% of the tests give P-values below 1%, then Verizon is deemed to be discriminating. Figure 3.4 shows the raw data for one of these tests. The mean of 1664 repairs for ILEC customers is 8.4 h, while the mean for 23 repairs for CLEC customers is 16.5 h. Could a difference that large easily be explained by chance? There ILEC ILEC 1200 150 800 100 600 400- 50 200- 50 100 150 200 -3 -2 -1 O 1 2 Ropair times Theoretical quantiles GLEC CLEC kouenbery Sample quantiles CLEC CLEC 100 15 80 10 60 40 20 50 100 150 200 12 Repair times Theoretical quantles Figure 3.4 Distribution of repair times for Verizon (ILEC) and competitor (CLEC customens. Note that the Y-axis scales are different. appears to be one outlier in the smaller data set; perhaps that explains the difference in means? However, it would not be reasonable to throw out that observation as faulty - it is clear from the larger data set that large repair times do occur fairly frequently. Furthermore, even in the middle of both distribu- tions, the CLEC times do appear to be longer (this is apparent in panel (b). There are curious bends in the normal quantile plot, due to 24h cycles. Let a, denote the mean repair time for the ILEC customers and u, the mean repair time for the CLEC customers. We test H,i H = H versus H H. < We use a one-sided test because the alternative of interest to the PUC is that the CLEC customers are receiving worse service (longer repair times) than the ILEC customers. louerba Sample quantiles 3.5 In the flight delays case study in Section 1.1, the data contain flight delays for two airlines, American Airlines and United Airlines. a) Conduct a two-sided permutation test to see if the difference in mean delay times between the two carriers are statistically significant. b) The flights took place in May and June of 2009. Conduct a two-sided permutation test to see if the difference in mean delay times between the two months is statistically significant.
Step by Step Solution
★★★★★
3.55 Rating (166 Votes )
There are 3 Steps involved in it
Step: 1
According to the chegg guideline Im solving only question ...
Get Instant Access to Expert-Tailored Solutions
See step-by-step solutions with expert insights and AI powered tools for academic success
Step: 2

Step: 3

Ace Your Homework with AI
Get the answers you need in no time with our AI-driven, step-by-step assistance
Get Started


