

Answered step by step
Verified Expert Solution
Question
1 Approved Answer
Exercise 02 We are going to consider the following stock portfolios. This time we want to see what pair of stocks gives us the best
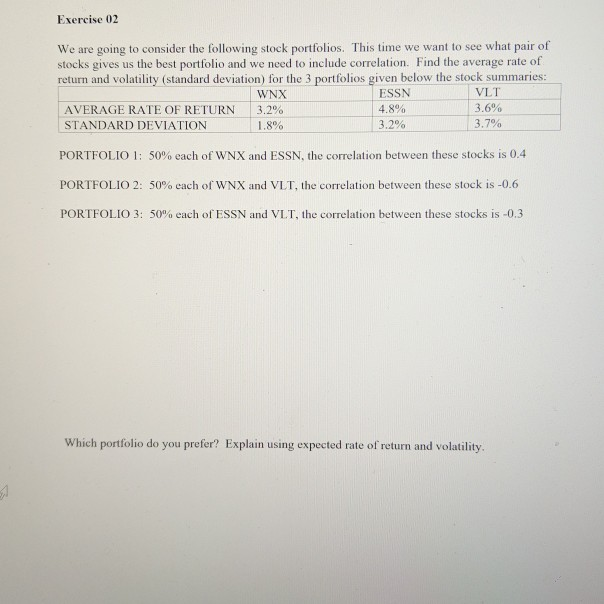
Exercise 02 We are going to consider the following stock portfolios. This time we want to see what pair of stocks gives us the best portfolio and we need to include correlation. Find the average rate of return and volatility (standard deviation) for the 3 portfolios given below the stock summaries: WNX ESSN VLT AVERAGE RATE OF RETURN 3.2% 4.8% 3.6% STANDARD DEVIATION 1.8% 3.2% 3.7% PORTFOLIO 1: 50% each of WNX and ESSN, the correlation between these stocks is 0.4 PORTFOLIO 2: 50% each of WNX and VLT, the correlation between these stock is -0.6 PORTFOLIO 3: 50% each of ESSN and VLT, the correlation between these stocks is -0.3 Which portfolio do you prefer? Explain using expected rate of return and volatility
Step by Step Solution
There are 3 Steps involved in it
Step: 1

Get Instant Access to Expert-Tailored Solutions
See step-by-step solutions with expert insights and AI powered tools for academic success
Step: 2

Step: 3
Ace Your Homework with AI
Get the answers you need in no time with our AI-driven, step-by-step assistance
Get Started
Mein Ultimativer Weihnachts Planer
Authors: Zizo Nimane
1st Edition
B0CM2J8GTG