

Answered step by step
Verified Expert Solution
Question
1 Approved Answer
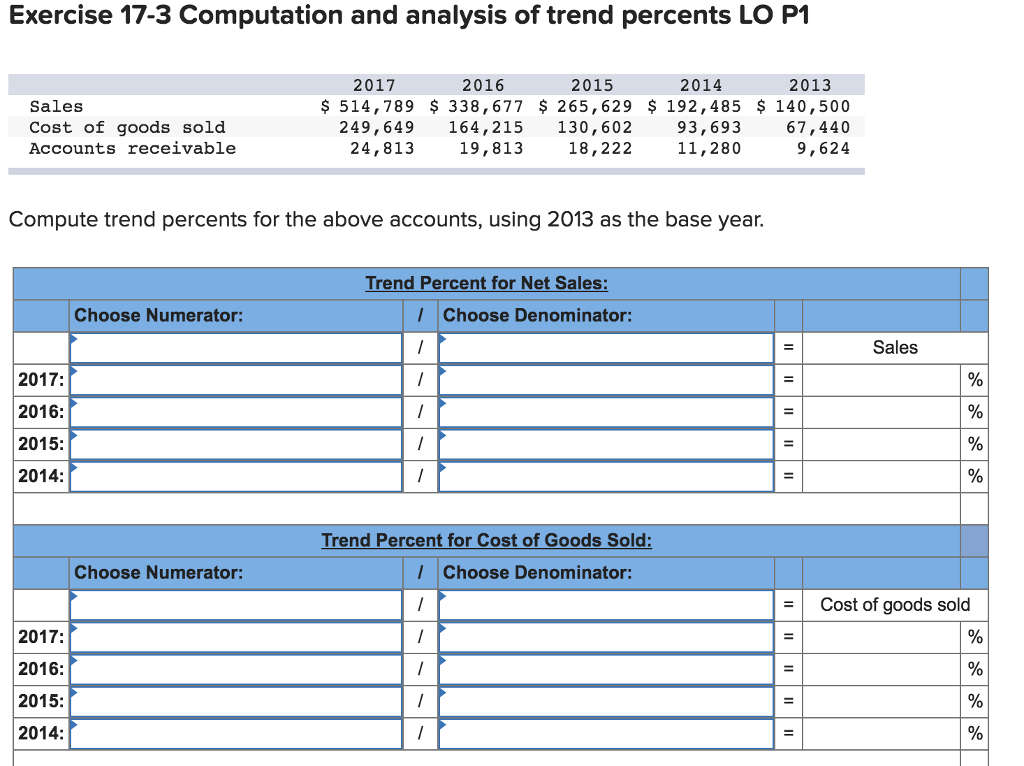
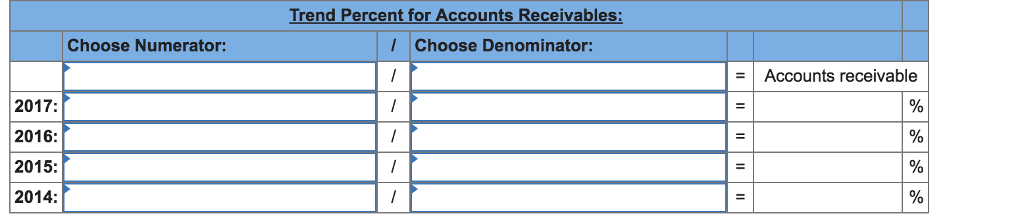
Exercise 17-3 Computation and analysis of trend percents LO P1 Sales Cost of goods sold Accounts receivable 2017 2016 2015 2013 $ 514,789 $ 338,677
Step by Step Solution
There are 3 Steps involved in it
Step: 1

Get Instant Access to Expert-Tailored Solutions
See step-by-step solutions with expert insights and AI powered tools for academic success
Step: 2

Step: 3
Ace Your Homework with AI
Get the answers you need in no time with our AI-driven, step-by-step assistance
Get Started
Intermediate accounting
Authors: J. David Spiceland, James Sepe, Mark Nelson
7th edition
978-0077614041, 9780077446475, 77614046, 007744647X, 77647092, 978-0077647094