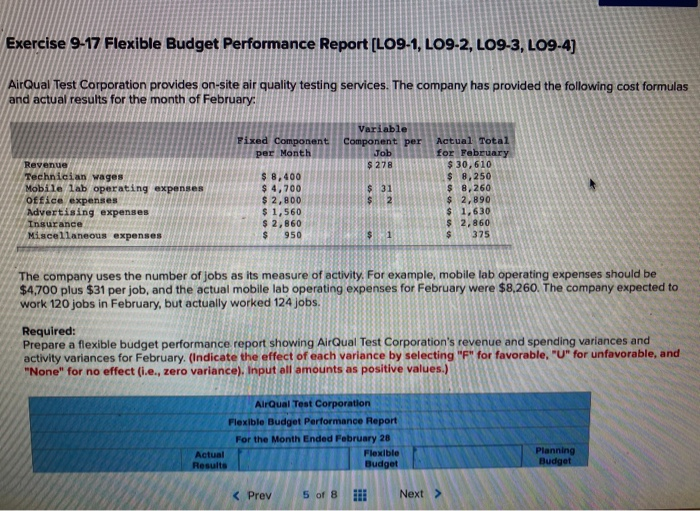
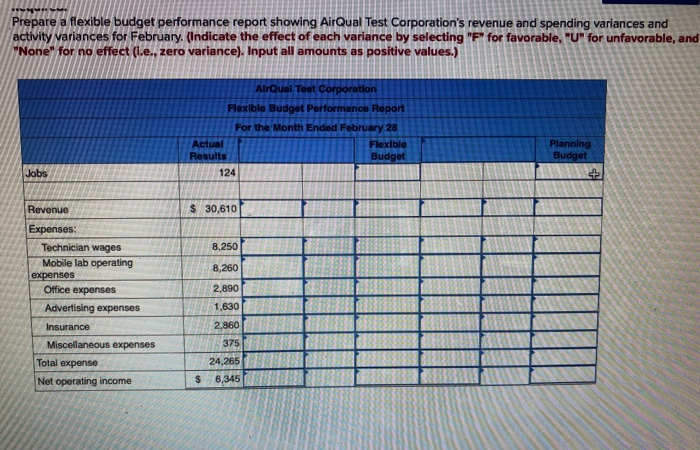
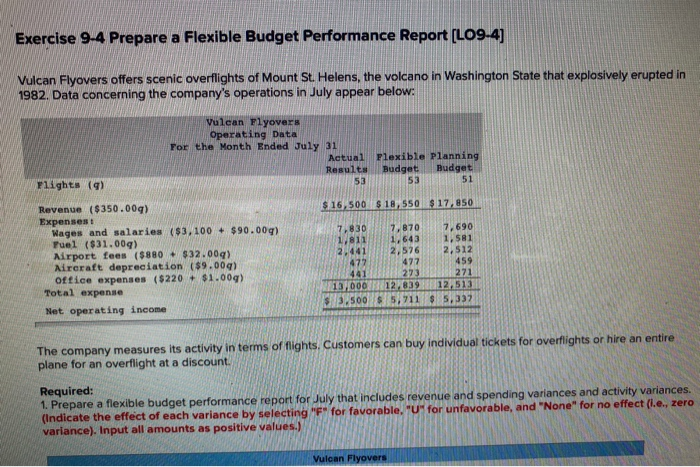
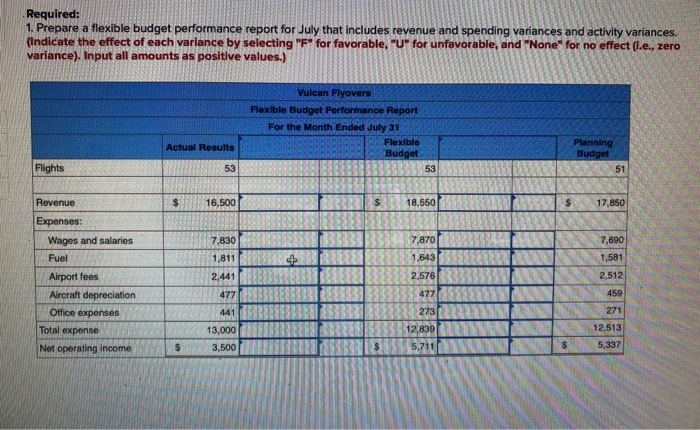
Exercise 9-17 Flexible Budget Performance Report (LO9-1, LO9-2, LO9-3, LO9-4) AirQual Test Corporation provides on-site air quality testing services. The company has provided the following cost formulas and actual results for the month of February Fixed Component per Month Variable Component per Job $ 278 Revenue Technician wages Mobile lab operating expenses Office expenses Advertising expenses Insurance Miscellaneous expenses $ 31 $ 2 $ 8,400 $ 4,700 $ 2,800 $ 1,560 $ 2,860 $ 950 Actual Total for February $ 30,610 $ 8,250 $ 8,260 $ 2,890 $ 1,630 $ 2,860 $ 375 1 The company uses the number of jobs as its measure of activity. For example, mobile lab operating expenses should be $4,700 plus $31 per job, and the actual mobile lab operating expenses for February were $8,260. The company expected to work 120 jobs in February, but actually worked 124 jobs. Required: Prepare a flexible budget performance report showing AirQual Test Corporation's revenue and spending variances and activity variances for February (Indicate the effect of each variance by selecting "F" for favorable, "U" for unfavorable, and "None" for no effect (i.e., zero variance). Input all amounts as positive values.) AlrQual Test Corporation Flexible Budget Performance Report For the Month Ended February 28 Actual Flexible Results Budget Planning Budget Prepare a flexible budget performance report showing AirQual Test Corporation's revenue and spending variances and activity variances for February (Indicate the effect of each variance by selecting "F" for favorable, "U" for unfavorable, and "None" for no effect (i.e., zero variance). Input all amounts as positive values.) AlrQual Test Corporation Flexible Budget Performance Report For the Month Ended February 28 Actual Flexible Results Budget 124 Planning Budget Jobs $ 30,610 8,250 8,260 Revenue Expenses: Technician wages Mobile lab operating expenses Office expenses Advertising expenses Insurance Miscellaneous expenses Total expense Net operating income 2,890 1,630 2,860 375 24,265 6,345 $ Exercise 9-4 Prepare a Flexible Budget Performance Report (LO9-4) Vulcan Flyovers offers scenic overflights of Mount St. Helens, the volcano in Washington State that explosively erupted in 1982. Data concerning the company's operations in July appear below: Vulcan Flyovers Operating Data For the Month Ended July 31 Actual Results 53 Flexible Planning Budget Budget 53 51 Flights (9) $ 16,500 $ 18,550 $ 17.850 Revenue ($350.009) Expenses Wages and salaries ($3,100 + $90.000) Fuel ($31.009) Airport fees ($880 + $32.009) Aircraft depreciation ($9.000) office expenses ($220 + $1.009) Total expense Net operating income 7,830 7,870 7.690 1,811 1.643 1,581 2,441 2,576 2,512 472 477 459 441 273 271 13,000 12,839 12,513 $3.500 $5,711 $5,337 The company measures its activity in terms of flights. Customers can buy individual tickets for overflights or hire an entire plane for an overflight at a discount. Required: 1. Prepare a flexible budget performance report for July that includes revenue and spending variances and activity variances. (Indicate the effect of each variance by selecting "F" for favorable, "U" for unfavorable, and "None" for no effect (1.e., zero variance). Input all amounts as positive values.) Vulcan Flyovers Required: 1. Prepare a flexible budget performance report for July that includes revenue and spending variances and activity variances. (Indicate the effect of each variance by selecting "F" for favorable, "U" for unfavorable, and "None" for no effect (i.e., zero variance). Input all amounts as positive values.) Vulcan Flyovers Flexible Budget Performance Report For the Month Ended July 31 Flexible Budget 53 Actual Results Planning Budget 51 Flights 53 Revenue $ 16,500 $ 18,550 $ 17,850 7,690 7,830 1,811 7,870 1.643 1,581 2,441 2.576 2,512 Expenses: Wages and salaries Fuel Airport fees Aircraft depreciation Office expenses Total expense Net operating income 477 477 459 441 273 271 13,000 3,500 12,839 5,711 12,513 5,337 $ $
