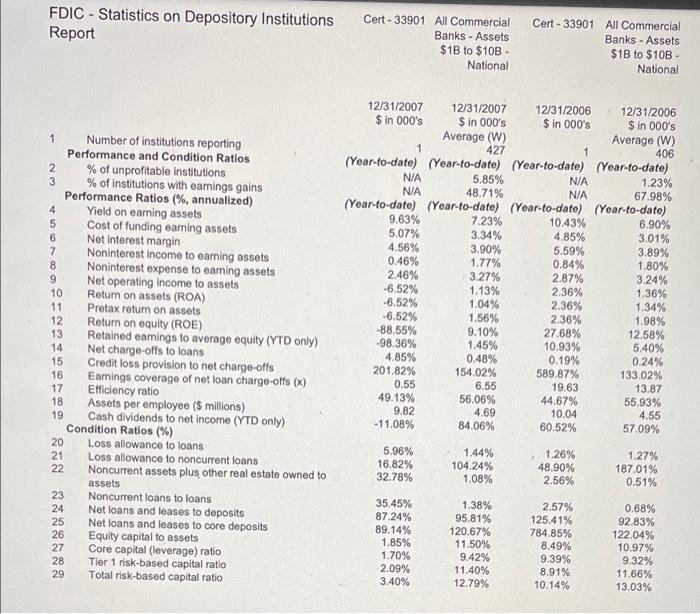
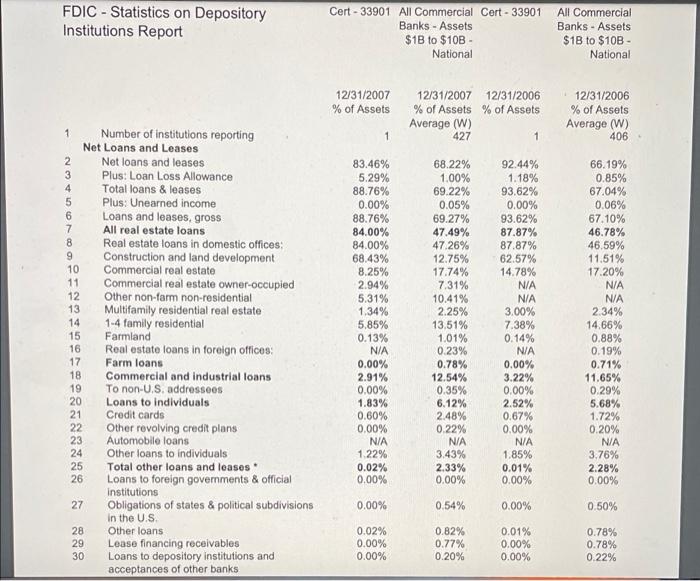
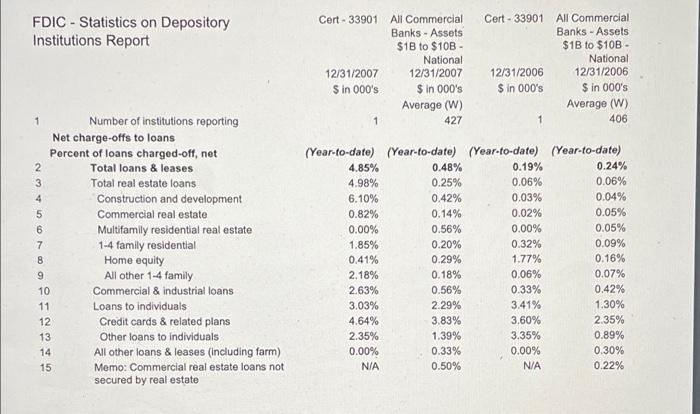
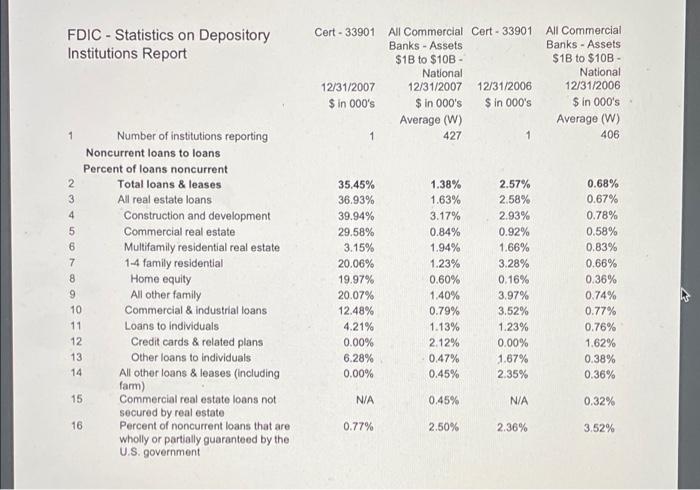
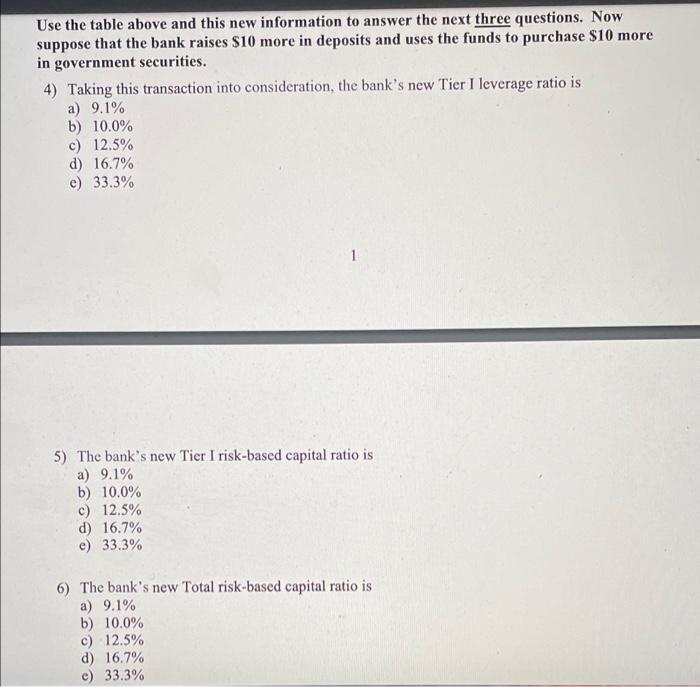
FDIC - Statistics on Depository Institutions Report Cert- 33901 All Commercial Banks - Assets $1 to $10B - National Cert - 33901 All Commercial Banks - Assets $18 to $10B National 4 1 Number of institutions reporting Performance and Condition Ratios 2 % of unprofitable institutions 3 % of institutions with eamings gains Performance Ratios (%, annualized) Yield on eaming assets 5 Cost of funding earning assets 6 Net interest margin 7 Noninterest income to eaming assets 8 Noninterest expense to eaming assets 9 Net operating income to assets 10 Return on assets (ROA) 11 Pretax retum on assets 12 Return on equity (ROE) 13 Retained earings to average equity (YTD only) 14 Net charge-offs to loans 15 Credit loss provision to net charge-offs 16 Eamings coverage of net loan charge-offs (x) 17 Efficiency ratio 18 Assets per employee (5 millions) 19 Cash dividends to net income (YTD only) Condition Ratios (%) 20 Loss allowance to loans 21 Loss allowance to noncurrent loans 22 Noncurrent assets plus other real estate owned to assets 23 Noncurrent loans to loans 24 Net loans and leases to deposits 25 Net loans and leases to core deposits 26 Equity capital to assets 27 Core capital (leverage) ratio 28 Tier 1 risk-based capital ratio 29 Total risk-based capital ratio 12/31/2007 12/31/2007 12/31/2006 12/31/2006 $ in 000's $ in 000's $ in 000's Sin 000's Average (W) Average (W) 1 427 1 406 (Year-to-date) (Year-to-date) (Year-to-date) (Year-to-date) NA 5.85% N/A 1.23% N/A 48.71% N/A 67.98% (Year-to-date) (Year-to-date) (Year-to-date) (Year-to-date) 9.63% 7.23% 10.43% 6,90% 5.07% 3.34% 4.85% 3.01% 4.56% 3.90% 5.59% 3.89% 0.46% 1.77% 0.84% 1.80% 2.46% 3.27% 2.87% 3.24% -6.52% 1.13% 2.36% 1.36% -6.52% 1.04% 2.36% 1.34% -6.52% 1.56% 2.36% 1.98% -88.55% 9.10% 27.68% 12.58% -98.36% 1.45% 10.93% 5.40% 4.85% 0.48% 0.19% 0.24% 201.82% 154.02% 589.87% 133.02% 0.55 6.55 19.63 13.87 49.13% 56.06% 44.67% 55.93% 9.82 4.69 10.04 4.55 -11.08% 84,06% 60.52% 57.09% 5.96% 16.82% 32.78% 1.44% 104.24% 1.08% 1.26% 48.90% 2.56% 1.27% 187.01% 0.51% 35.45% 87.24% 89.14% 1.85% 1.70% 2.09% 3.40% 1.38% 95.81% 120.67% 11.50% 9.42% 11.40% 12.79% 2.57% 125.41% 784.85% 8.49% 9.39% 8.91% 10.14% 0.68% 92.83% 122.04% 10.97% 9.32% 11.66% 13.03% FDIC - Statistics on Depository Institutions Report Cert - 33901 All Commercial Cert - 33901 Banks - Assets $1 to $10B National All Commercial Banks - Assets $18 to $10B National 12/31/2007 % of Assets 12/31/2007 12/31/2006 % of Assets % of Assets Average (W) 427 12/31/2006 % of Assets Average (W) 406 ON 9 1 Number of institutions reporting Net Loans and Leases 2 Net loans and leases 3 Plus: Loan Loss Allowance 4 Total loans & leases 5 Plus: Unearned income 6 Loans and leases, gross 7 All real estate loans 8 Real estate loans in domestic offices: Construction and land development 10 Commercial real estate 11 Commercial real estate owner-occupied 12 Other non-farm non-residential 13 Multifamily residential real estate 14 1-4 family residential 15 Farmland 16 Real estate loans in foreign offices 17 Farm loans 18 Commercial and industrial loans 19 To nonU.S. addresses 20 Loans to individuals 21 Credit cards 22 Other revolving credit plans 23 Automobile loans 24 Other loans to individuals 25 Total other loans and leases 26 Loans to foreign governments & official Institutions 27 Obligations of states & political subdivisions in the US 28 Other loans 29 Lease financing receivables 30 Loans to depository institutions and acceptances of other banks 83.46% 5.29% 88.76% 0.00% 88.76% 84.00% 84.00% 68.43% 8.25% 2.94% 5.31% 1.34% 5.85% 0.13% N/A 0.00% 2.91% 0.00% 1.83% 0.60% 0.00% N/A 1.22% 0.02% 0.00% 68.22% 1.00% 69.22% 0.05% 69.27% 47.49% 47.26% 12.75% 17.74% 7.31% 10.41% 2.25% 13,51% 1.01% 0.23% 0.78% 12.54% 0.35% 6.12% 2.48% 0.22% N/A 3.43% 2.33% 0.00% 92.44% 1.18% 93.62% 0.00% 93.62% 87.87% 87.87% 62.57% 14.78% N/A N/A 3.00% 7.38% 0.14% NA 0.00% 3.22% 0.00% 2.52% 0.67% 0.00% NIA 1.85% 0.01% 0.00% 66.19% 0.85% 67.04% 0.06% 67.10% 46.78% 46.59% 11.51% 17.20% NIA NA 2.34% 14.66% 0.88% 0.19% 0.71% 11.65% 0.29% 5.68% 1.72% 0.20% NA 3.76% 2.28% 0.00% 0.00% 0.54% 0.00% 0.50% 0.02% 0.00% 0.00% 0.82% 0.77% 0.20% 0.01% 0.00% 0.00% 0.78% 0.78% 0.22% FDIC - Statistics on Depository Institutions Report Cert - 33901 All Commercial Banks - Assets $1 to $10B - National 12/31/2007 12/31/2007 Sin 000's $ in 000's Average (W) 1 427 Cert- 33901 All Commercial Banks - Assets $1 to $10B National 12/31/2006 12/31/2006 $ in 000's $ in 000's Average (W) 1 406 4 6 Number of institutions reporting Net charge-offs to loans Percent of loans charged-off, net 2 Total loans & leases 3 Total real estate loans Construction and development 5 Commercial real estate Multifamily residential real estate 7 1-4 family residential Home equity 9 All other 1-4 family 10 Commercial & Industrial loans 11 Loans to individuals 12 Credit cards & related plans 13 Other loans to individuals 14 All other loans & leases (including farm) 15 Memo: Commercial real estate loans not secured by real estate 8 (Year-to-date) (Year-to-date) (Year-to-date) (Year-to-date) 4.85% 0.48% 0.19% 0.24% 4.98% 0.25% 0.06% 0.06% 6.10% 0.42% 0.03% 0.04% 0.82% 0.14% 0.02% 0.05% 0.00% 0.56% 0.00% 0.05% 1.85% 0.20% 0.32% 0.09% 0.41% 0.29% 1.77% 0.16% 2.18% 0.18% 0.06% 0.07% 2.63% 0.56% 0.33% 0.42% 3.03% 2.29% 3.41% 1.30% 4.64% 3.83% 3.60% 2.35% 2.35% 1.39% 3.35% 0.89% 0.00% 0.33% 0.00% 0.30% N/A 0.50% N/A 0.22% FDIC - Statistics on Depository Institutions Report Cert - 33901 All Commercial Cert - 33901 Banks - Assets $18 to $10B - National 12/31/2007 12/31/2007 12/31/2006 $ in 000's $ in 000's $ in 000's Average (W) 1 427 1 All Commercial Banks - Assets $1 to $10B National 12/31/2006 $ in 000's Average (W) 406 1 4 Number of institutions reporting Noncurrent loans to loans Percent of loans noncurrent 2 Total loans & leases 3 All real estate loans Construction and development 5 Commercial real estate 6 Multifamily residential real estate 7 1-4 family residential 8 Home equity 9 All other family 10 Commercial & Industrial loans 11 Loans to individuals 12 Credit cards & related plans 13 Other loans to individuals 14 All other loans & leases (including farm) 15 Commercial real estate loans not secured by real estate 16 Percent of noncurrent loans that are wholly or partially guaranteed by the U.S. government 35.45% 36.93% 39.94% 29.58% 3.15% 20.06% 19.97% 20.07% 12.48% 4.21% 0.00% 6.28% 0.00% 1.38% 1.63% 3.17% 0.84% 1.94% 1.23% 0.60% 1.40% 0.79% 1.13% 2.12% 0.47% 0.45% 2.57% 2.58% 2.93% 0.92% 1.66% 3.28% 0.16% 3.97% 3.52% 1.23% 0.00% 1.67% 2.35% 0.68% 0.67% 0.78% 0.58% 0.83% 0.66% 0.36% 0.74% 0.77% 0.76% 1.62% 0.38% 0.36% N/A 0,45% N/A 0.32% 0.77% 2.50% 2.36% 3.52% Use the table above and this new information to answer the next three questions. Now suppose that the bank raises $10 more in deposits and uses the funds to purchase $10 more in government securities. 4) Taking this transaction into consideration, the bank's new Tier I leverage ratio is a) 9.1% b) 10.0% c) 12.5% d) 16.7% e) 33.3% 5) The bank's new Tier I risk-based capital ratio is a) 9.1% b) 10.0% c) 12.5% d) 16.7% e) 33.3% 6) The bank's new Total risk-based capital ratio is a) 9.1% b) 10.0% c) 12.5% d) 16.7% c) 33.3% FDIC - Statistics on Depository Institutions Report Cert- 33901 All Commercial Banks - Assets $1 to $10B - National Cert - 33901 All Commercial Banks - Assets $18 to $10B National 4 1 Number of institutions reporting Performance and Condition Ratios 2 % of unprofitable institutions 3 % of institutions with eamings gains Performance Ratios (%, annualized) Yield on eaming assets 5 Cost of funding earning assets 6 Net interest margin 7 Noninterest income to eaming assets 8 Noninterest expense to eaming assets 9 Net operating income to assets 10 Return on assets (ROA) 11 Pretax retum on assets 12 Return on equity (ROE) 13 Retained earings to average equity (YTD only) 14 Net charge-offs to loans 15 Credit loss provision to net charge-offs 16 Eamings coverage of net loan charge-offs (x) 17 Efficiency ratio 18 Assets per employee (5 millions) 19 Cash dividends to net income (YTD only) Condition Ratios (%) 20 Loss allowance to loans 21 Loss allowance to noncurrent loans 22 Noncurrent assets plus other real estate owned to assets 23 Noncurrent loans to loans 24 Net loans and leases to deposits 25 Net loans and leases to core deposits 26 Equity capital to assets 27 Core capital (leverage) ratio 28 Tier 1 risk-based capital ratio 29 Total risk-based capital ratio 12/31/2007 12/31/2007 12/31/2006 12/31/2006 $ in 000's $ in 000's $ in 000's Sin 000's Average (W) Average (W) 1 427 1 406 (Year-to-date) (Year-to-date) (Year-to-date) (Year-to-date) NA 5.85% N/A 1.23% N/A 48.71% N/A 67.98% (Year-to-date) (Year-to-date) (Year-to-date) (Year-to-date) 9.63% 7.23% 10.43% 6,90% 5.07% 3.34% 4.85% 3.01% 4.56% 3.90% 5.59% 3.89% 0.46% 1.77% 0.84% 1.80% 2.46% 3.27% 2.87% 3.24% -6.52% 1.13% 2.36% 1.36% -6.52% 1.04% 2.36% 1.34% -6.52% 1.56% 2.36% 1.98% -88.55% 9.10% 27.68% 12.58% -98.36% 1.45% 10.93% 5.40% 4.85% 0.48% 0.19% 0.24% 201.82% 154.02% 589.87% 133.02% 0.55 6.55 19.63 13.87 49.13% 56.06% 44.67% 55.93% 9.82 4.69 10.04 4.55 -11.08% 84,06% 60.52% 57.09% 5.96% 16.82% 32.78% 1.44% 104.24% 1.08% 1.26% 48.90% 2.56% 1.27% 187.01% 0.51% 35.45% 87.24% 89.14% 1.85% 1.70% 2.09% 3.40% 1.38% 95.81% 120.67% 11.50% 9.42% 11.40% 12.79% 2.57% 125.41% 784.85% 8.49% 9.39% 8.91% 10.14% 0.68% 92.83% 122.04% 10.97% 9.32% 11.66% 13.03% FDIC - Statistics on Depository Institutions Report Cert - 33901 All Commercial Cert - 33901 Banks - Assets $1 to $10B National All Commercial Banks - Assets $18 to $10B National 12/31/2007 % of Assets 12/31/2007 12/31/2006 % of Assets % of Assets Average (W) 427 12/31/2006 % of Assets Average (W) 406 ON 9 1 Number of institutions reporting Net Loans and Leases 2 Net loans and leases 3 Plus: Loan Loss Allowance 4 Total loans & leases 5 Plus: Unearned income 6 Loans and leases, gross 7 All real estate loans 8 Real estate loans in domestic offices: Construction and land development 10 Commercial real estate 11 Commercial real estate owner-occupied 12 Other non-farm non-residential 13 Multifamily residential real estate 14 1-4 family residential 15 Farmland 16 Real estate loans in foreign offices 17 Farm loans 18 Commercial and industrial loans 19 To nonU.S. addresses 20 Loans to individuals 21 Credit cards 22 Other revolving credit plans 23 Automobile loans 24 Other loans to individuals 25 Total other loans and leases 26 Loans to foreign governments & official Institutions 27 Obligations of states & political subdivisions in the US 28 Other loans 29 Lease financing receivables 30 Loans to depository institutions and acceptances of other banks 83.46% 5.29% 88.76% 0.00% 88.76% 84.00% 84.00% 68.43% 8.25% 2.94% 5.31% 1.34% 5.85% 0.13% N/A 0.00% 2.91% 0.00% 1.83% 0.60% 0.00% N/A 1.22% 0.02% 0.00% 68.22% 1.00% 69.22% 0.05% 69.27% 47.49% 47.26% 12.75% 17.74% 7.31% 10.41% 2.25% 13,51% 1.01% 0.23% 0.78% 12.54% 0.35% 6.12% 2.48% 0.22% N/A 3.43% 2.33% 0.00% 92.44% 1.18% 93.62% 0.00% 93.62% 87.87% 87.87% 62.57% 14.78% N/A N/A 3.00% 7.38% 0.14% NA 0.00% 3.22% 0.00% 2.52% 0.67% 0.00% NIA 1.85% 0.01% 0.00% 66.19% 0.85% 67.04% 0.06% 67.10% 46.78% 46.59% 11.51% 17.20% NIA NA 2.34% 14.66% 0.88% 0.19% 0.71% 11.65% 0.29% 5.68% 1.72% 0.20% NA 3.76% 2.28% 0.00% 0.00% 0.54% 0.00% 0.50% 0.02% 0.00% 0.00% 0.82% 0.77% 0.20% 0.01% 0.00% 0.00% 0.78% 0.78% 0.22% FDIC - Statistics on Depository Institutions Report Cert - 33901 All Commercial Banks - Assets $1 to $10B - National 12/31/2007 12/31/2007 Sin 000's $ in 000's Average (W) 1 427 Cert- 33901 All Commercial Banks - Assets $1 to $10B National 12/31/2006 12/31/2006 $ in 000's $ in 000's Average (W) 1 406 4 6 Number of institutions reporting Net charge-offs to loans Percent of loans charged-off, net 2 Total loans & leases 3 Total real estate loans Construction and development 5 Commercial real estate Multifamily residential real estate 7 1-4 family residential Home equity 9 All other 1-4 family 10 Commercial & Industrial loans 11 Loans to individuals 12 Credit cards & related plans 13 Other loans to individuals 14 All other loans & leases (including farm) 15 Memo: Commercial real estate loans not secured by real estate 8 (Year-to-date) (Year-to-date) (Year-to-date) (Year-to-date) 4.85% 0.48% 0.19% 0.24% 4.98% 0.25% 0.06% 0.06% 6.10% 0.42% 0.03% 0.04% 0.82% 0.14% 0.02% 0.05% 0.00% 0.56% 0.00% 0.05% 1.85% 0.20% 0.32% 0.09% 0.41% 0.29% 1.77% 0.16% 2.18% 0.18% 0.06% 0.07% 2.63% 0.56% 0.33% 0.42% 3.03% 2.29% 3.41% 1.30% 4.64% 3.83% 3.60% 2.35% 2.35% 1.39% 3.35% 0.89% 0.00% 0.33% 0.00% 0.30% N/A 0.50% N/A 0.22% FDIC - Statistics on Depository Institutions Report Cert - 33901 All Commercial Cert - 33901 Banks - Assets $18 to $10B - National 12/31/2007 12/31/2007 12/31/2006 $ in 000's $ in 000's $ in 000's Average (W) 1 427 1 All Commercial Banks - Assets $1 to $10B National 12/31/2006 $ in 000's Average (W) 406 1 4 Number of institutions reporting Noncurrent loans to loans Percent of loans noncurrent 2 Total loans & leases 3 All real estate loans Construction and development 5 Commercial real estate 6 Multifamily residential real estate 7 1-4 family residential 8 Home equity 9 All other family 10 Commercial & Industrial loans 11 Loans to individuals 12 Credit cards & related plans 13 Other loans to individuals 14 All other loans & leases (including farm) 15 Commercial real estate loans not secured by real estate 16 Percent of noncurrent loans that are wholly or partially guaranteed by the U.S. government 35.45% 36.93% 39.94% 29.58% 3.15% 20.06% 19.97% 20.07% 12.48% 4.21% 0.00% 6.28% 0.00% 1.38% 1.63% 3.17% 0.84% 1.94% 1.23% 0.60% 1.40% 0.79% 1.13% 2.12% 0.47% 0.45% 2.57% 2.58% 2.93% 0.92% 1.66% 3.28% 0.16% 3.97% 3.52% 1.23% 0.00% 1.67% 2.35% 0.68% 0.67% 0.78% 0.58% 0.83% 0.66% 0.36% 0.74% 0.77% 0.76% 1.62% 0.38% 0.36% N/A 0,45% N/A 0.32% 0.77% 2.50% 2.36% 3.52% Use the table above and this new information to answer the next three questions. Now suppose that the bank raises $10 more in deposits and uses the funds to purchase $10 more in government securities. 4) Taking this transaction into consideration, the bank's new Tier I leverage ratio is a) 9.1% b) 10.0% c) 12.5% d) 16.7% e) 33.3% 5) The bank's new Tier I risk-based capital ratio is a) 9.1% b) 10.0% c) 12.5% d) 16.7% e) 33.3% 6) The bank's new Total risk-based capital ratio is a) 9.1% b) 10.0% c) 12.5% d) 16.7% c) 33.3%
