Answered step by step
Verified Expert Solution
Question
1 Approved Answer
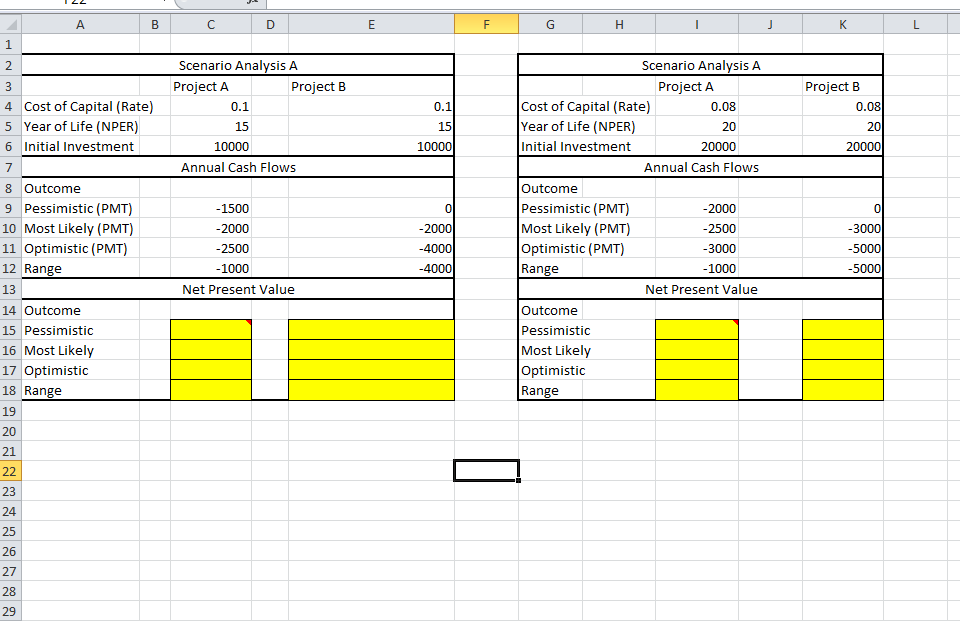
Financial Management(Please explain to get this answer) Scenario Analysis A Project A 2 Scenario Analysis A Project B Project A Project B 4 Cost of
Financial Management(Please explain to get this answer)
Step by Step Solution
There are 3 Steps involved in it
Step: 1

Get Instant Access to Expert-Tailored Solutions
See step-by-step solutions with expert insights and AI powered tools for academic success
Step: 2

Step: 3
Ace Your Homework with AI
Get the answers you need in no time with our AI-driven, step-by-step assistance
Get Started