Answered step by step
Verified Expert Solution
Question
1 Approved Answer
Five elite track athletes volunteer to participate in an experiment to compare two brands of running shoes. Each athlete runs the 100-meter race twice,

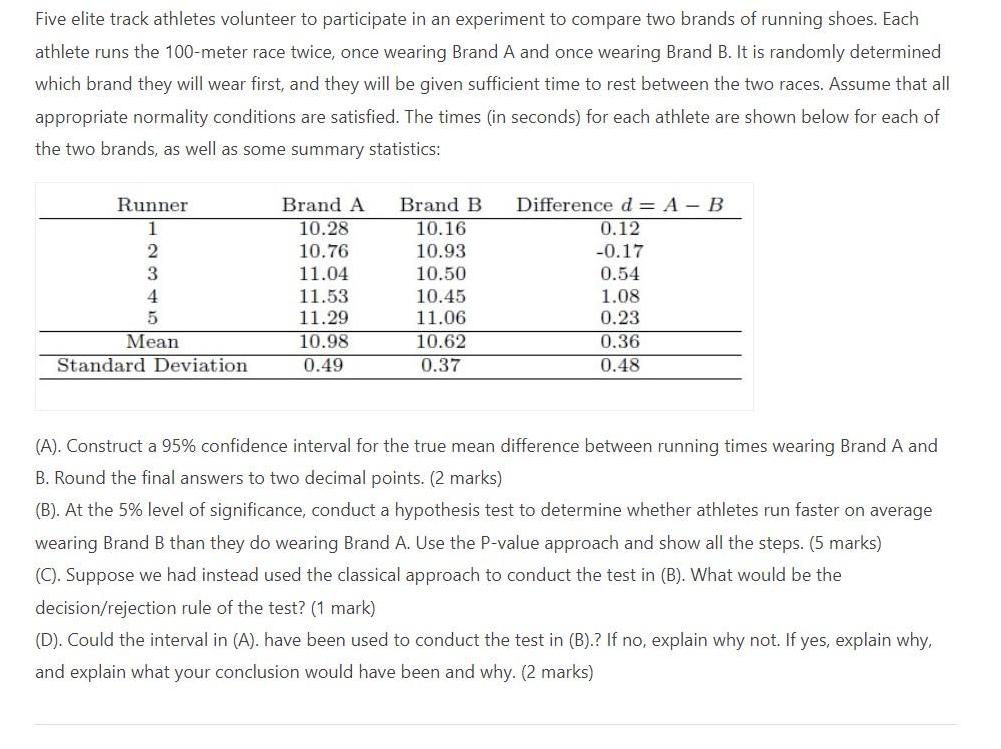
Five elite track athletes volunteer to participate in an experiment to compare two brands of running shoes. Each athlete runs the 100-meter race twice, once wearing Brand A and once wearing Brand B. It is randomly determined which brand they will wear first, and they will be given sufficient time to rest between the two races. Assume that all appropriate normality conditions are satisfied. The times (in seconds) for each athlete are shown below for each of the two brands, as well as some summary statistics: Runner 1 2 3 4 5 Mean Standard Deviation Brand A 10.28 10.76 11.04 11.53 11.29 10.98 0.49 Brand B 10.16 10.93 10.50 10.45 11.06 10.62 0.37 Difference d-A-B 0.12 -0.17 0.54 1.08 0.23 0.36 0.48 (A). Construct a 95% confidence interval for the true mean difference between running times wearing Brand A and B. Round the final answers to two decimal points. (2 marks) (B). At the 5% level of significance, conduct a hypothesis test to determine whether athletes run faster on average wearing Brand B than they do wearing Brand A. Use the P-value approach and show all the steps. (5 marks) (C). Suppose we had instead used the classical approach to conduct the test in (B). What would be the decision/rejection rule of the test? (1 mark) (D). Could the interval in (A). have been used to conduct the test in (B).? If no, explain why not. If yes, explain why, and explain what your conclusion would have been and why. (2 marks)
Step by Step Solution
★★★★★
3.33 Rating (168 Votes )
There are 3 Steps involved in it
Step: 1
A To construct a 95 confidence interval for the true mean difference between running times wearing Brand A and Brand B we can use the formula Confidence Interval mean difference critical value standar...
Get Instant Access to Expert-Tailored Solutions
See step-by-step solutions with expert insights and AI powered tools for academic success
Step: 2

Step: 3

Ace Your Homework with AI
Get the answers you need in no time with our AI-driven, step-by-step assistance
Get Started


