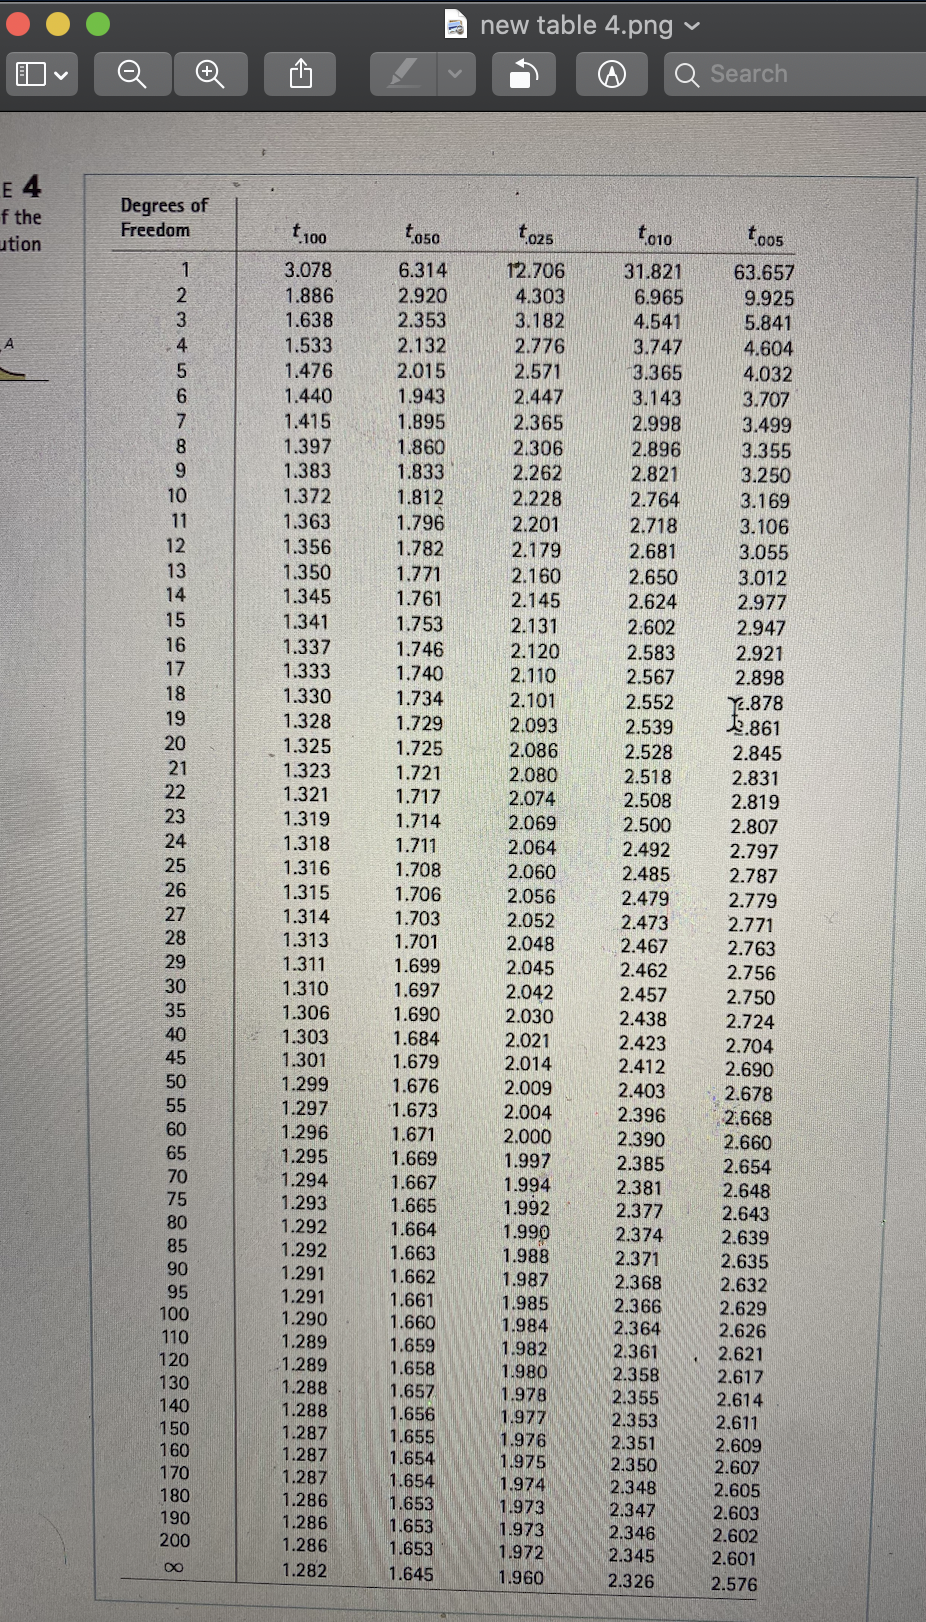
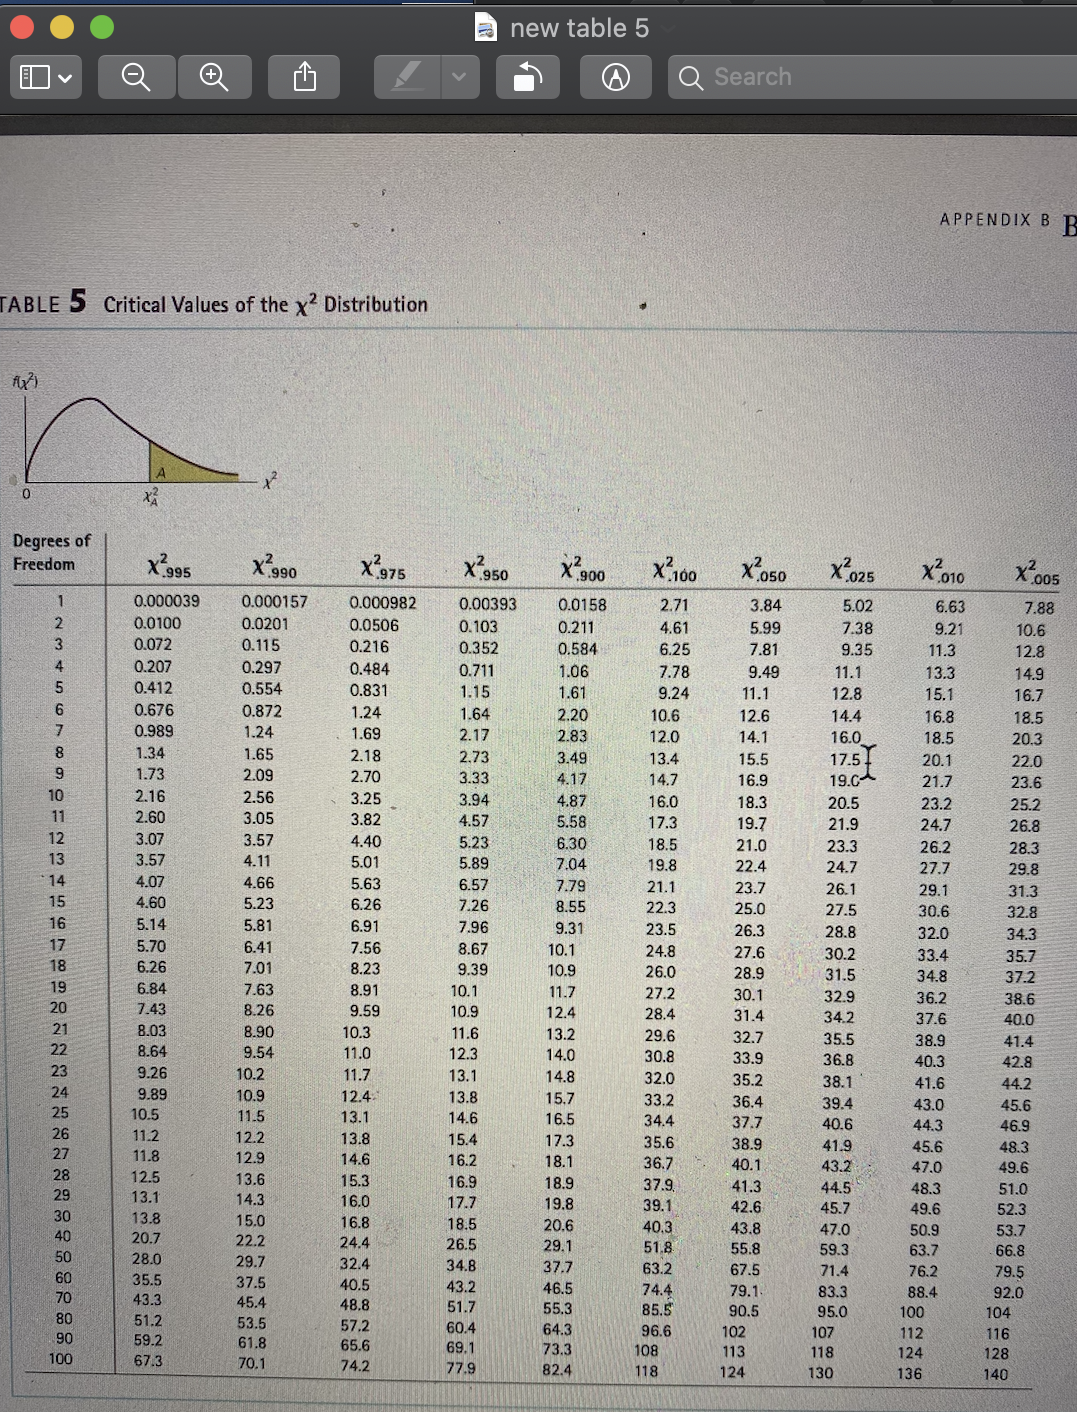
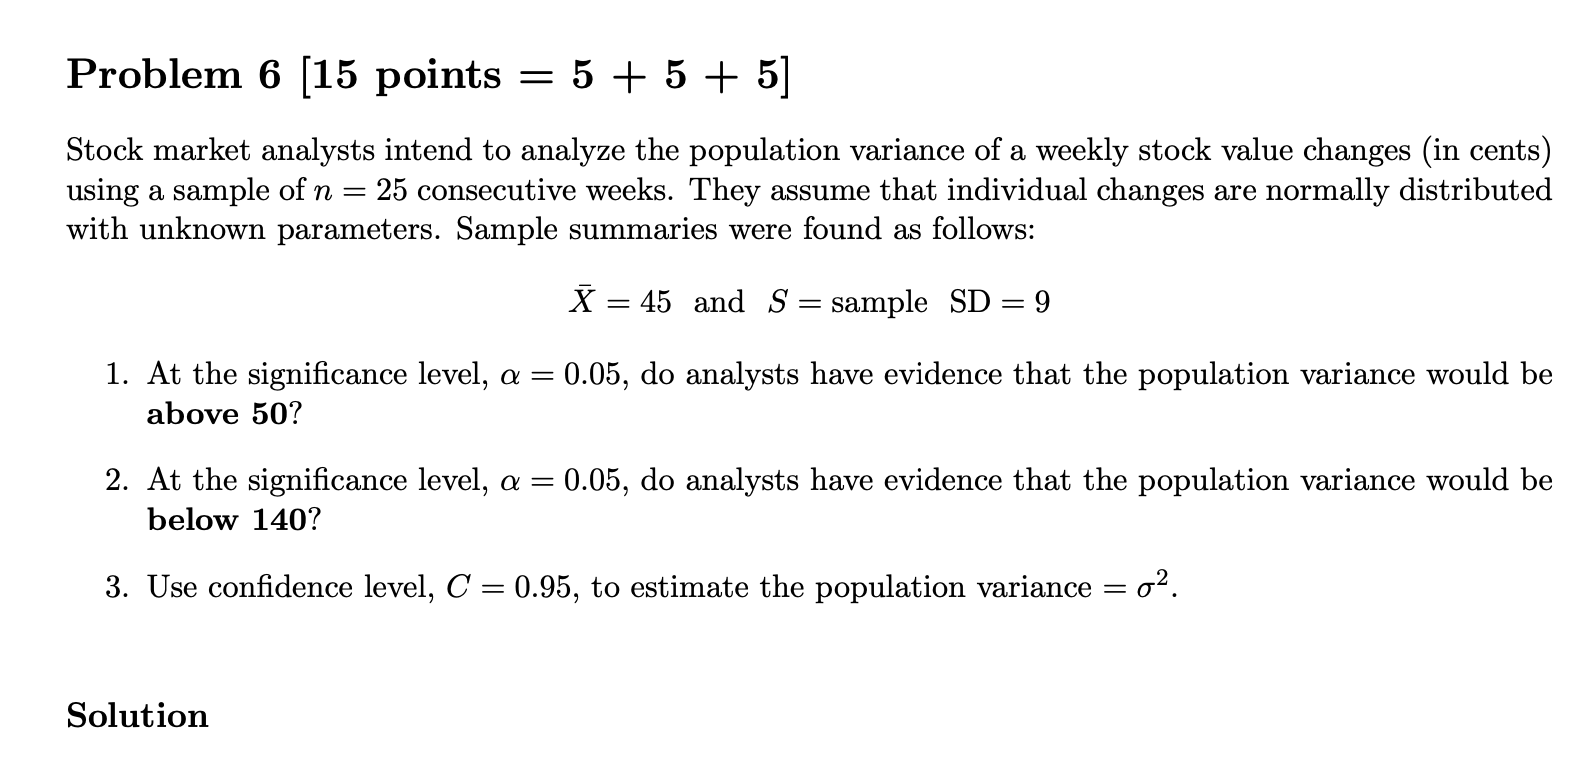
\fnew table 5 A Q Search +) v APPENDIX B B ABLE 5 Critical Values of the x2 Distribution A x2 Degrees of X'-025 X-010 X-005 Freedom X-995 X-990 X-975 X-950 X-900 X-100 X:050 0.0158 2.71 3.84 5.02 6.63 7.88 0.000039 0.000157 0.000982 0.00393 0.0201 0.0506 0.103 0.211 4.61 5.99 7.38 9.21 10.6 0.0100 0.352 0.584 6.25 7.81 9.35 11.3 12.8 0.072 0.115 0.216 7.78 9.49 11.1 13.3 14.9 0.207 0.29 0.484 0.711 1.06 12.8 15.1 16.7 0.412 0.554 0.831 1.15 1.61 9.24 11.1 12.6 14.4 16.8 18.5 0.676 0.872 1.24 1.64 2.20 10.6 1.69 2.17 2.83 12.0 14.1 16.0 18.5 20.3 0.989 1.24 20.1 22.0 1.34 1.65 2.18 2.73 3.49 13.4 15.5 17.5 2.09 2.70 3.33 4.17 14.7 16.9 19.C- 21.7 23.6 1.73 16.0 18.3 20.5 23.2 25.2 2.16 2.56 3.25 3.94 4.87 5.58 17.3 19.7 21.9 24.7 26.8 2.60 3.05 3.82 4.57 18.5 21.0 23.3 26.2 28.3 6.30 12 3.07 3.57 4.40 5.23 5.01 5.89 7.04 19.8 22.4 24.7 27.7 29.8 13 3.57 4.11 21.1 23.7 26.1 29.1 31.3 14 4.07 4.66 5.63 6.57 7.79 32.8 15 4.60 5.23 6.26 7.26 8.55 22.3 25.0 27.5 30.6 6.91 7.96 9.31 23.5 26.3 28.8 32.0 34.3 16 5.14 5.81 35.7 5.70 6.41 7.56 8.67 10.1 24.8 27.6 30.2 33.4 34.8 37.2 6.26 7.01 8.23 9.39 10.9 26.0 28.9 31.5 10.1 11.7 27.2 30.1 32.9 36.2 38.6 6.84 7.63 8.91 10.9 12.4 28.4 31.4 34.2 37.6 40.0 20 7.43 8.26 9.59 41.4 8.03 8.90 10.3 11.6 13.2 29.6 32.7 35.5 38.9 11.0 12.3 14.0 30.8 33.9 36.8 40.3 42.8 8.64 9.54 38.1 41.6 44.2 23 9.26 10.2 11.7 13.1 14.8 32.0 35.2 15,7 33.2 36.4 39.4 43.0 45.6 24 9.89 10.9 12.4 13.8 37.7 40.6 44.3 46.9 25 10.5 11.5 13.1 14.6 16.5 34.4 13.8 15.4 17.3 35.6 38.9 41.9 45.6 48.3 26 11.2 12.2 27 12.9 16.2 18.1 36.7 40.1 43.2 47.0 49.6 11.8 14.6 48.3 51.0 28 12.5 13.6 15.3 16.9 18.9 37.9. 41.3 44.5 16.0 17.7 19.8 39.1 42.6 45.7 49.6 52.3 13.1 14.3 15.0 18.5 20.6 40.3 43.8 47.0 50.9 53.7 13.8 16.8 29.1 51.8 55.8 59.3 63.7 66.8 20.7 22.2 24.4 26.5 $4.8 63.2 67.5 71.4 76.2 79.5 28.0 29.7 32.4 37.7 92.0 35.5 37.5 40.5 43.2 46.5 74.4 79.1 83.3 88.4 8883868 95.0 100 104 43.3 45.4 48.8 51.7 55.3 85.5 90.5 51.2 53.5 60.4 64.3 96.6 102 107 112 116 57.2 124 128 59.2 61.8 65.6 69.1 73.3 108 113 118 136 67.3 130 140 70.1 74.2 77.9 82.4 118 124Instruct ions 0 For hypothesis testing problems, please indicate critical value (or values), state rejection rule, evaluate test statistic, and nally, formulate your decision in the form YES, enough evidence to reject the null hypothesis or NO, not enough evidence to reject H0. 0 For condence intervals, specify critical values and indicate the formula that you are using for limits, UCL and LCL 0 You Will need critical values for t and x2-distributions (Tables 4 and 5 in the textbook). Problem 6 [15 points = 5 + 5 + 5] Stock market analysts intend to analyze the population variance of a weekly stock value changes (in cents) using a sample of n = 25 consecutive weeks. They assume that individual changes are normally distributed with unknown parameters. Sample summaries were found as follows: X =45 and S = sample SD = 9 1. At the significance level, a = 0.05, do analysts have evidence that the population variance would be above 50? 2. At the significance level, a = 0.05, do analysts have evidence that the population variance would be below 140? 3. Use confidence level, C = 0.95, to estimate the population variance = 02. Solution


