

Answered step by step
Verified Expert Solution
Question
1 Approved Answer
Forecast the accidental deaths in the U.S.A. for each month in 1979. 1. The following table shows the monthly accidental deaths (in thousands) in the
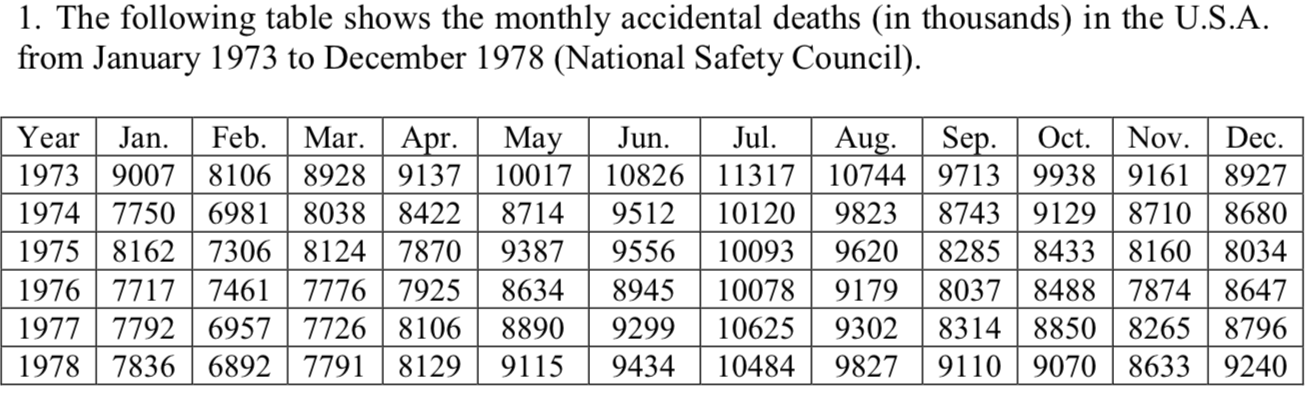
Forecast the accidental deaths in the U.S.A. for each month in 1979.
1. The following table shows the monthly accidental deaths (in thousands) in the U.S.A. from January 1973 to December 1978 (National Safety Council). Year Jan. Feb. Mar. Apr. May Jun Jul Aug Sep. Oct. Nov. | Dec. 1973 | 9007 8106 8928 9137 | 10017 | 10826 | 11317 | 10744 9713 9938 9161 8927 1974 77506981 | 8038 8422 8714 | 9512 101209823 8743 91298710 8680 1975 | 8162 7306 8124 78709387 | 9556 100939620 8285 | 8433 8160 8034 1976 | 7717 7461 7776 | 7925 8634 8945 | 10078 9179 8037 8488 7874 8647 1977 | 7792 6957 7726 8106 8890 9299 | 10625 9302 8314 8850 8265 8796 1978 | 7836 6892 | 7791 8129 9115 9434 | 10484 9827 9110 90708633 9240Step by Step Solution
There are 3 Steps involved in it
Step: 1

Get Instant Access to Expert-Tailored Solutions
See step-by-step solutions with expert insights and AI powered tools for academic success
Step: 2

Step: 3
Ace Your Homework with AI
Get the answers you need in no time with our AI-driven, step-by-step assistance
Get Started
Residential Energy Audit Manual
Authors: Fairmont
1st Edition
0915586541, 978-0915586547