Form a complete portfolio by combining the T-Note and the optimal risky portfolio8. The corresponding weights for the T-Note and the optimal portfolio depend on your risk aversion. Imagine that you have $10,000 to invest, and indicate how you would allocate this money between your two stocks and the T-Note. Explain your allocation decision 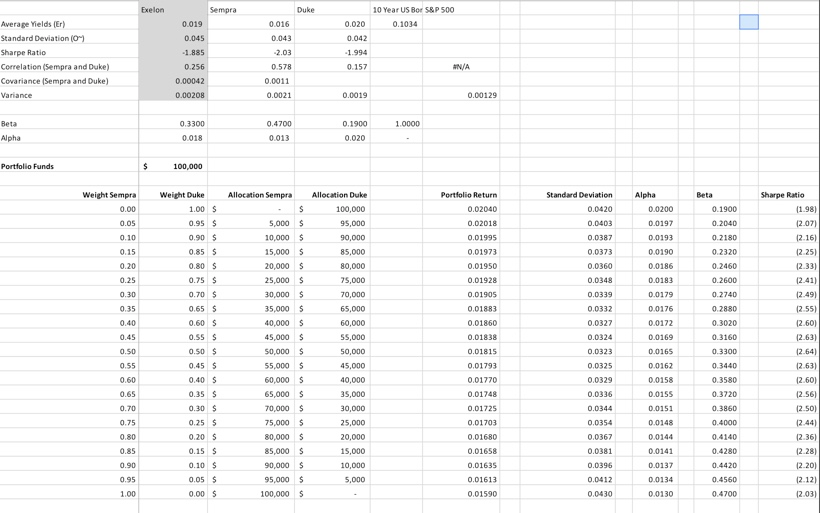
Exelon Duke Average Yields (Er) Standard Deviation (0) Sharpe Ratio Correlation (Sempra and Duke) Covariance Sempra and Duke) Variance Sempra 0.019 0.045 -1.885 0.256 0.00042 0.00208 0.016 0.043 2.03 0.578 0.0011 0.0021 10 Year US Bor S&P 500 0.0200 .1034 0.042 -1.994 0.157 AN/A 0.0019 0.00129 1.0000 Beta Alpha 0.3300 0.018 0.4700 0.013 0.1900 0.020 Portfolio Funds 100,000 Allocation Sempra Weight Sempra 0.00 0.05 0.10 0.15 0.20 0.25 0.30 0.35 0.40 0.45 Weight Duke 1.00 S 0.95 $ 0.90 $ 0.85 5 0.80 $ 0.75 $ 0.70 $ 0.65 5 0.60 $ 0.SS 0.50 $ 0.45 5 0.40 $ 0.35 $ 0.30 $ 0.25 5 0.20 $ 0.15 S 0.10 $ 0.05 S 0.00 $ 5,000 10,000 15,000 20,000 25,000 30,000 35,000 40,000 45,000 50,000 55,000 60,000 65,000 70,000 75,000 80,000 85,000 90,000 95,000 100,000 Allocation Duke 100,000 95,000 90,000 85,000 80,000 75,000 70,000 65,000 60,000 55,000 50,000 45,000 40,000 35,000 30,000 25,000 20,000 15,000 10,000 5,000 $ $ $ $ $ $ $ $ $ $ $ $ $ $ $ $ $ $ $ $ Portfolio Return 0.02040 0.02018 0.01995 0.01973 0.01950 0.01928 0.01905 0.01883 0.01860 0.01838 0.01815 0.01793 0.01770 0.01748 0.01725 0.01703 0.01680 0.01658 0.01635 0.01613 0.01590 Standard Deviation 0.0420 0.0403 0.0387 0.0373 0.0360 0.0348 0.0339 0.0332 0.0327 0.0324 0.0323 0.0325 0.0329 0.0336 0.0344 0.0354 0.0367 0.0381 0.0396 0.0412 0.0430 Alpha 0.0200 0.0197 0.0193 0.0190 0.0186 0.0183 0.0179 0.0176 0.0172 0.0169 0.0165 0.0162 0.0158 0.0155 0.0151 0.0148 0.0144 0.0141 0.0137 0.0134 0.0130 Beta 0.1900 0.2040 0.2180 0.2320 0.2460 0.2600 0.2740 0.2880 0.3020 0.3160 0.3300 0.3440 0.3580 0.3720 0.3860 0.4000 0.4140 0.4280 0.4420 0.4560 0.4700 0.50 0.55 0.60 0.65 0.70 0.75 0.80 0.85 Sharpe Ratio (1.98) 12.071 12.16) 12.25) (2.33) (2.41) 12.49) 12.55) (2.60) (2.63) 12.64) (2.63) 12.60) 12.56) 12.50) 12.44) 12.36) 12.28) (2.20) 12.12) 12.03) 0.90 0.95 1.00 Exelon Duke Average Yields (Er) Standard Deviation (0) Sharpe Ratio Correlation (Sempra and Duke) Covariance Sempra and Duke) Variance Sempra 0.019 0.045 -1.885 0.256 0.00042 0.00208 0.016 0.043 2.03 0.578 0.0011 0.0021 10 Year US Bor S&P 500 0.0200 .1034 0.042 -1.994 0.157 AN/A 0.0019 0.00129 1.0000 Beta Alpha 0.3300 0.018 0.4700 0.013 0.1900 0.020 Portfolio Funds 100,000 Allocation Sempra Weight Sempra 0.00 0.05 0.10 0.15 0.20 0.25 0.30 0.35 0.40 0.45 Weight Duke 1.00 S 0.95 $ 0.90 $ 0.85 5 0.80 $ 0.75 $ 0.70 $ 0.65 5 0.60 $ 0.SS 0.50 $ 0.45 5 0.40 $ 0.35 $ 0.30 $ 0.25 5 0.20 $ 0.15 S 0.10 $ 0.05 S 0.00 $ 5,000 10,000 15,000 20,000 25,000 30,000 35,000 40,000 45,000 50,000 55,000 60,000 65,000 70,000 75,000 80,000 85,000 90,000 95,000 100,000 Allocation Duke 100,000 95,000 90,000 85,000 80,000 75,000 70,000 65,000 60,000 55,000 50,000 45,000 40,000 35,000 30,000 25,000 20,000 15,000 10,000 5,000 $ $ $ $ $ $ $ $ $ $ $ $ $ $ $ $ $ $ $ $ Portfolio Return 0.02040 0.02018 0.01995 0.01973 0.01950 0.01928 0.01905 0.01883 0.01860 0.01838 0.01815 0.01793 0.01770 0.01748 0.01725 0.01703 0.01680 0.01658 0.01635 0.01613 0.01590 Standard Deviation 0.0420 0.0403 0.0387 0.0373 0.0360 0.0348 0.0339 0.0332 0.0327 0.0324 0.0323 0.0325 0.0329 0.0336 0.0344 0.0354 0.0367 0.0381 0.0396 0.0412 0.0430 Alpha 0.0200 0.0197 0.0193 0.0190 0.0186 0.0183 0.0179 0.0176 0.0172 0.0169 0.0165 0.0162 0.0158 0.0155 0.0151 0.0148 0.0144 0.0141 0.0137 0.0134 0.0130 Beta 0.1900 0.2040 0.2180 0.2320 0.2460 0.2600 0.2740 0.2880 0.3020 0.3160 0.3300 0.3440 0.3580 0.3720 0.3860 0.4000 0.4140 0.4280 0.4420 0.4560 0.4700 0.50 0.55 0.60 0.65 0.70 0.75 0.80 0.85 Sharpe Ratio (1.98) 12.071 12.16) 12.25) (2.33) (2.41) 12.49) 12.55) (2.60) (2.63) 12.64) (2.63) 12.60) 12.56) 12.50) 12.44) 12.36) 12.28) (2.20) 12.12) 12.03) 0.90 0.95 1.00