

Question
Four Corners What will your portfolio be worth in 10 years? In 20 years? When can you stop working? The Human Resources Department at Four
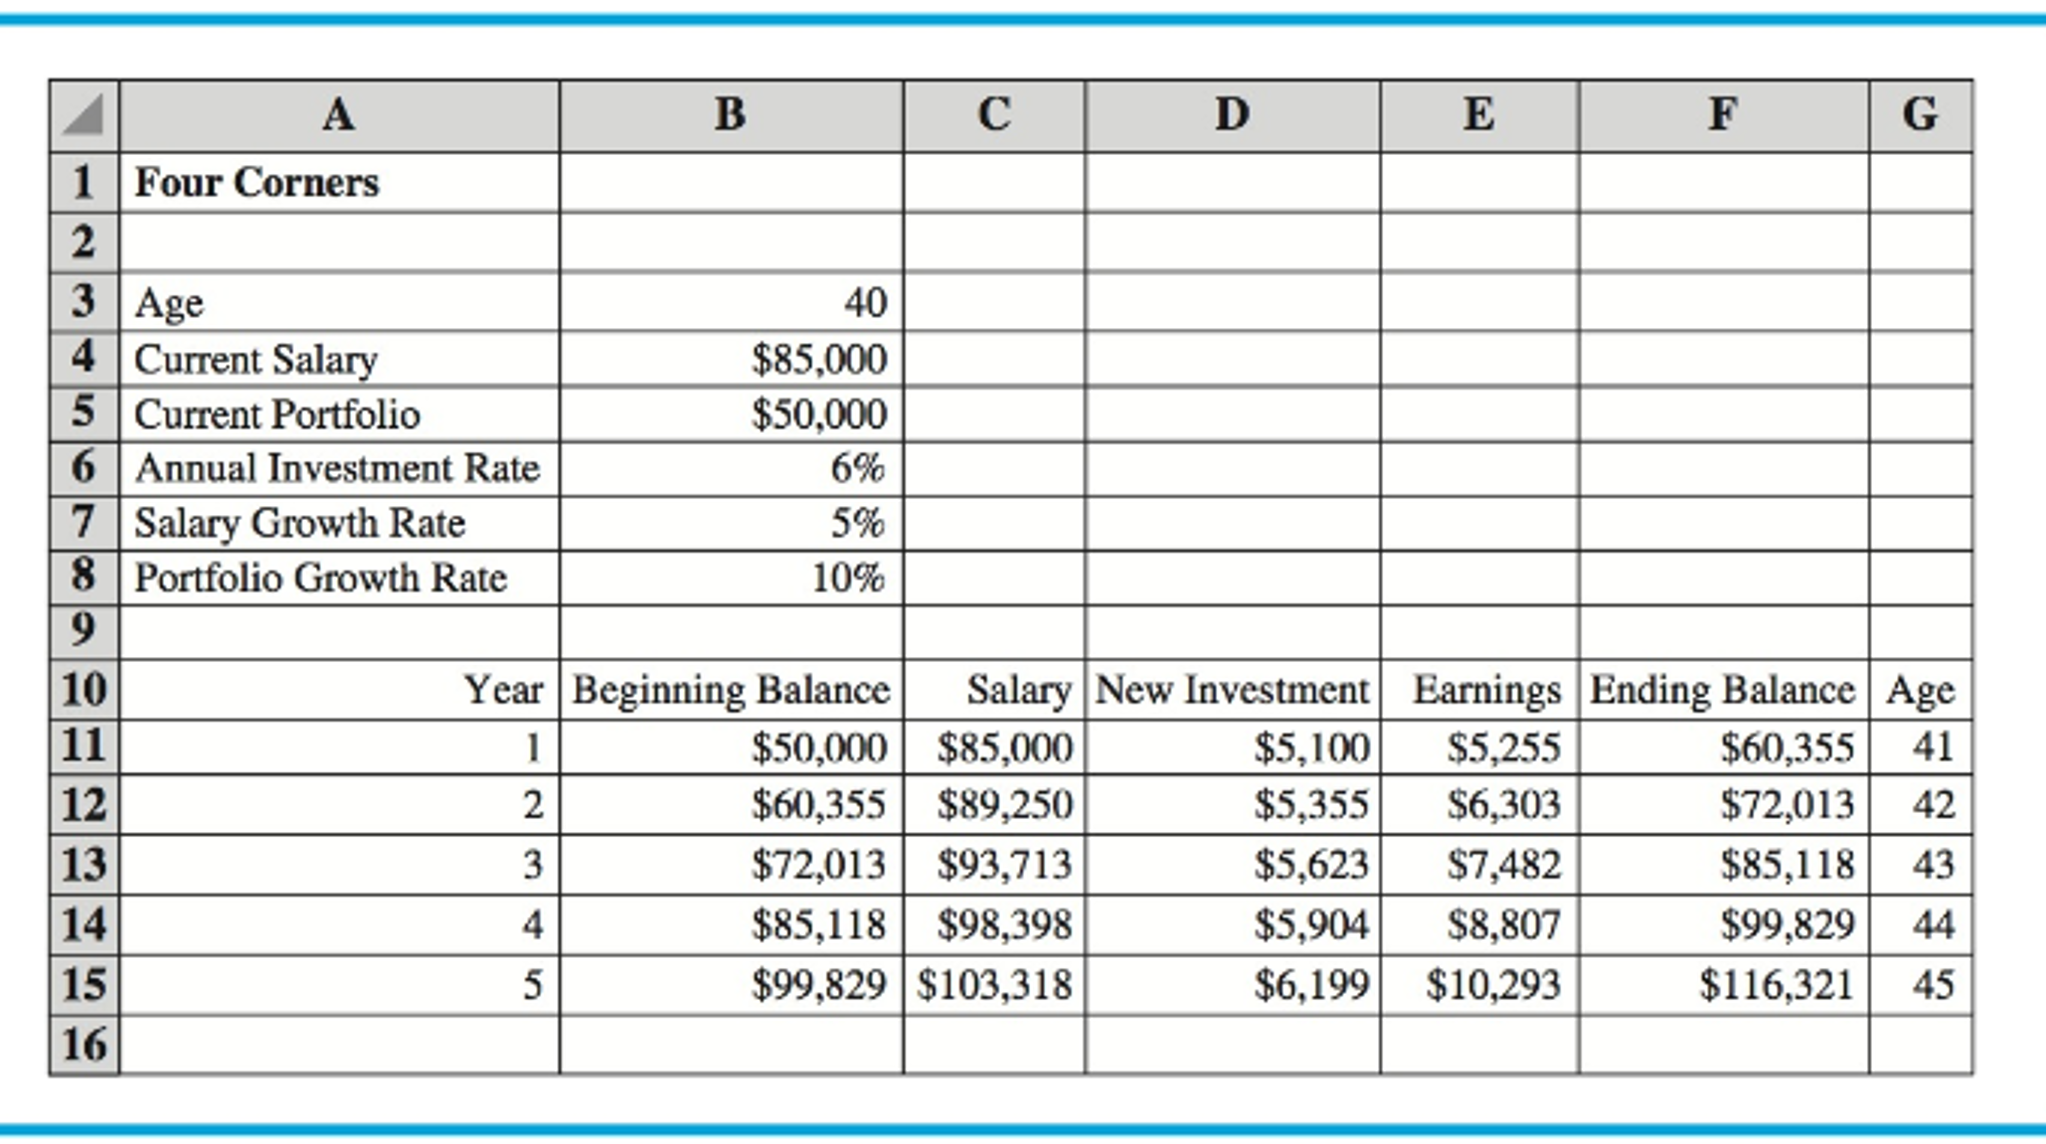
Four Corners What will your portfolio be worth in 10 years? In 20 years? When can you stop working? The Human Resources Department at Four Corners Corporation was asked to develop a financial planning model that would help employees address these questions. Tom Gifford was asked to lead this effort and decided to begin by developing a financial plan for him- self. Tom is 40 years old, has a degree in business, and earns an annual salary of $85,000. Through contributions to his companys retirement program and the receipt of a small in- heritance, Tom has accumulated a portfolio valued at $50,000. Tom plans to work 20 more years and hopes to accumulate a portfolio valued at $1,000,000. Can he do it? Tom began with a few assumptions about his future salary, his new investment con- tributions, and his portfolio growth rate. He assumed a 5% annual salary growth rate and plans to make new investment contributions at 6% of his salary. After some research on historical stock market performance, Tom decided that a 10% annual portfolio growth rate was reasonable. Using these assumptions, Tom developed the Excel worksheet shown in the figure below. The worksheet provides a financial projection for the next five years. In computing the portfolio earnings for a given year, Tom assumed that his new investment contribution would occur evenly throughout the year, and thus half of the new investment could be included in the computation of the portfolio earnings for the year. From the figure below, we see that at age 45, Tom is projected to have a portfolio valued at $116,321. Toms plan was to use this worksheet as a template to develop financial plans for the companys employees. The data in the spreadsheet would be tailored for each employee, and rows would be added to the worksheet to reflect the employees planning horizon. After adding another 15 rows to the worksheet, Tom found that he could expect to have a portfolio of $772,722 after 20 years. Tom then took his results to show his boss, Kate Krystkowiak. Although Kate was pleased with Toms progress, she voiced several criticisms. One of the criticisms was the assumption of a constant annual salary growth rate. She noted that most employees experience some variation in the annual salary growth rate from year to year. In addition, she pointed out that the constant annual portfolio growth rate was unrealistic and that the actual growth rate would vary considerably from year to year. She further suggested that a simulation model for the portfolio projection might allow Tom to account for the random variability in the salary growth rate and the portfolio growth rate. After some research, Tom and Kate decided to assume that the annual salary growth rate would vary from 0% to 5% and that a uniform probability distribution would provide a realistic approximation. Four Cornerss accountants suggested that the annual portfolio growth rate could be approximated by a normal probability distribution with a mean of 10% and a standard deviation of 5%. With this information, Tom set off to redesign his spreadsheet so that it could be used by the companys employees for financial planning. Play the role of Tom Gifford and develop a simulation model for financial planning.
Write a report for Toms boss and, at a minimum, include the following: Question Without considering the random variability, extend the current worksheet to 20 years. Confirm that by using the constant annual salary growth rate and the constant annual portfolio growth rate, Tom can expect to have a 20-year portfolio of $772,722. What would Toms annual investment rate have to increase to in order for his portfolio to reach a 20-year, $1,000,000 goal? Redesign the spreadsheet model to incorporate the random variability of the annual salary growth rate and the annual portfolio growth rate into a simulation model. Assume that Tom is willing to use the annual investment rate that predicted a 20-year, $1,000,000 portfolio in part 1. Show how to simulate Toms 20-year financial plan. Use results from the simulation model to comment on the uncertainty associated with Tom reaching the 20-year, $1,000,000 goal. What recommendations do you have for employees with a current profile similar to Toms after seeing the impact of the uncertainty in the annual salary growth rate and the annual portfolio growth rate? Assume that Tom is willing to consider working 25 more years instead of 20 years. What is your assessment of this strategy if Toms goal is to have a portfolio worth $1,000,000? Discuss how the financial planning model developed for Tom Gifford can be used as a template to develop a financial plan for any of the companys employees.
A B C D E F G 1 Four Corners 3 Age 40 4 Current Salary $85,000 5 Current Portfolio $50,000 6 Annual Investment Rate 6% 5% 7 Salary Growth Rate 8 Portfolio Growth Rate 10% Year Beginning Balance Salary New Investment Earnings Ending Balance Age 10 1 $50,000 $85,000 $5.100 $5,255 $60,355 41 11 2 $60,355 $89,250 $5.355 $6.303 $72,013 42 12 31 $72,013 $93,713 $5,623 $7,482 $85,118 43 13 4 $85,118 $98,398 $5,904 $8,807 $99,829 44 14 51 $99,829 $103,318 $6,199 $10,293 $116,321 45 15 16 A B C D E F G 1 Four Corners 3 Age 40 4 Current Salary $85,000 5 Current Portfolio $50,000 6 Annual Investment Rate 6% 5% 7 Salary Growth Rate 8 Portfolio Growth Rate 10% Year Beginning Balance Salary New Investment Earnings Ending Balance Age 10 1 $50,000 $85,000 $5.100 $5,255 $60,355 41 11 2 $60,355 $89,250 $5.355 $6.303 $72,013 42 12 31 $72,013 $93,713 $5,623 $7,482 $85,118 43 13 4 $85,118 $98,398 $5,904 $8,807 $99,829 44 14 51 $99,829 $103,318 $6,199 $10,293 $116,321 45 15 16Step by Step Solution
There are 3 Steps involved in it
Step: 1

Get Instant Access to Expert-Tailored Solutions
See step-by-step solutions with expert insights and AI powered tools for academic success
Step: 2

Step: 3
Ace Your Homework with AI
Get the answers you need in no time with our AI-driven, step-by-step assistance
Get Started
Social Media Audit And Stats Audit And Statistics For Social Media Platforms
Authors: Virtual Desk Tools
1st Edition
B09JDX8Z9M, 979-8492994938