

Question
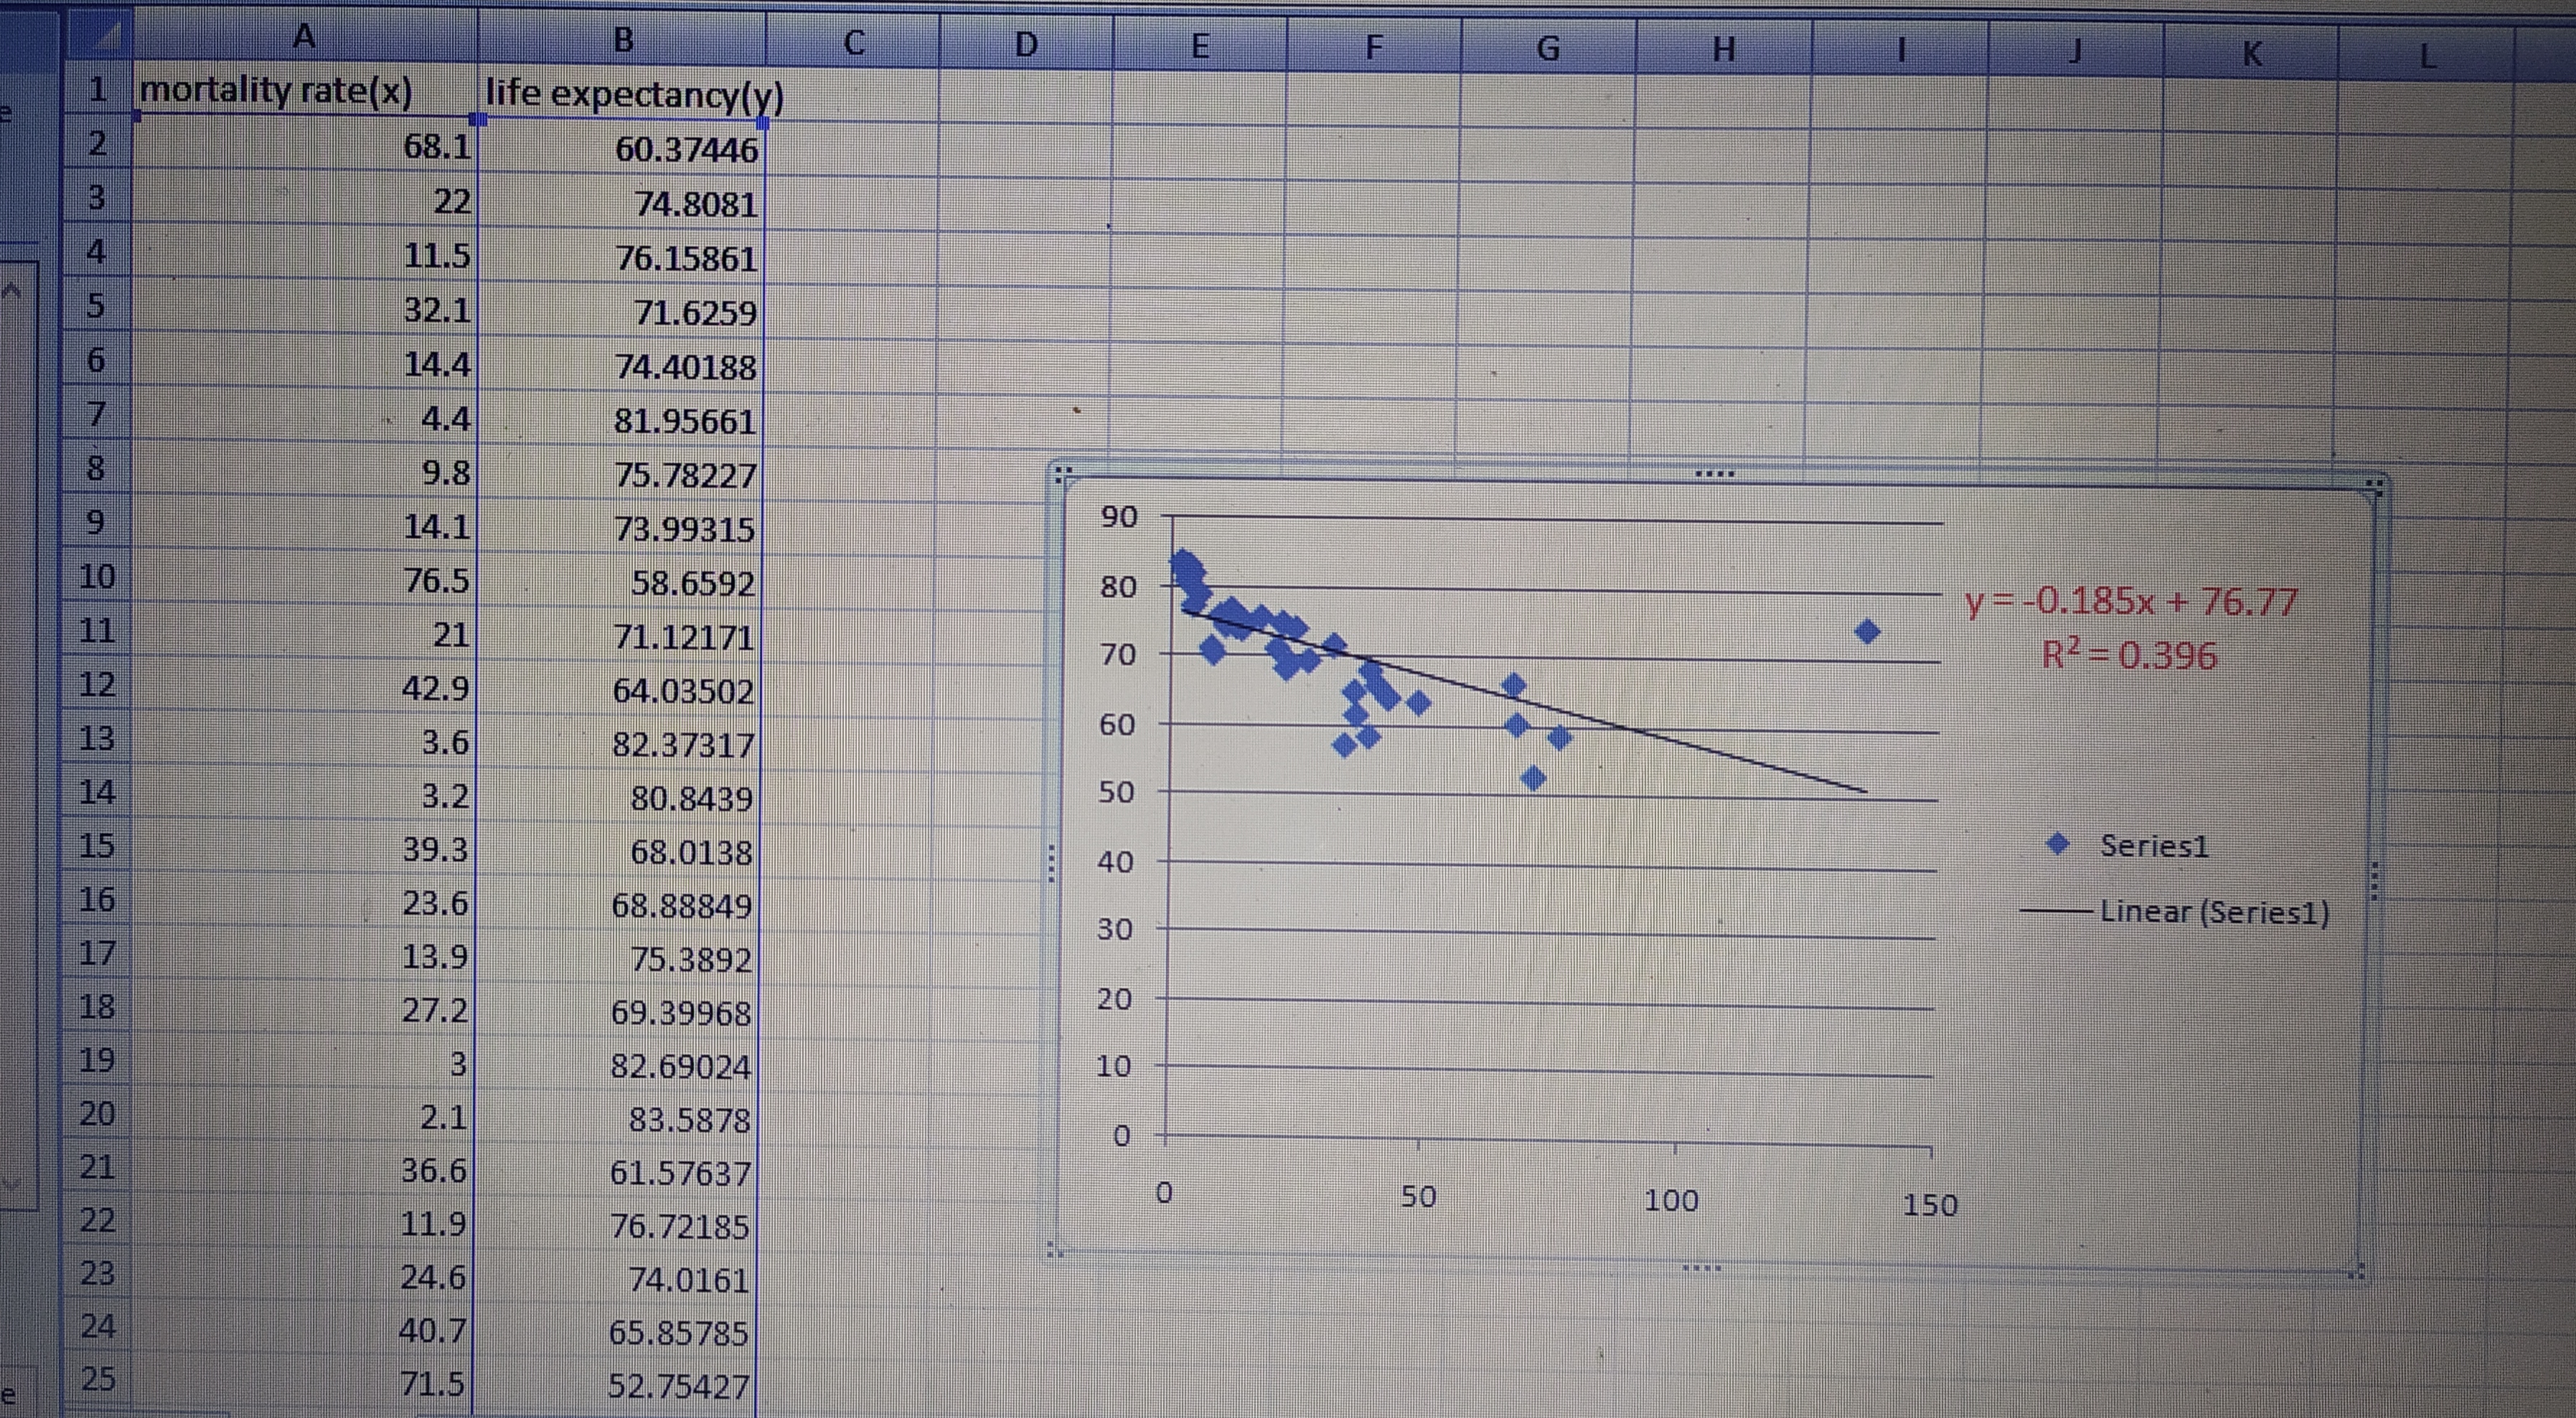
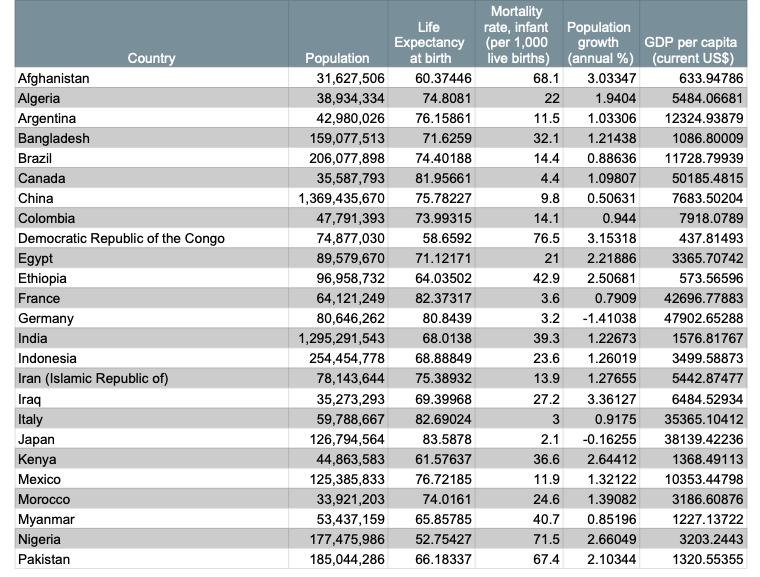
From the variables you chose ( I chose life expectancy and Mortality Rate) from thestatistics for 42 countriesin the previous activity, record the slope of
From the variables you chose ( I chose life expectancy and Mortality Rate) from thestatistics for 42 countriesin the previous activity, record the slope of the linear model.
Complete the following statement, which assumes a causal relationship,by replacing the words that show up in brackets with the appropriate words for your model:
"A one unitincrease in {independent variable} will CAUSE an {increase or decrease}in the {dependent variable} by {slope} units."
Share your statement
Also, Comment and answering the following question to show that you can communicate the danger associated with misclassifying a correlation as a cause and effect:
"If that statement was true, what would that imply for our world and the decision makers?"
your response should not be short.
Step by Step Solution
There are 3 Steps involved in it
Step: 1

Get Instant Access to Expert-Tailored Solutions
See step-by-step solutions with expert insights and AI powered tools for academic success
Step: 2

Step: 3
Ace Your Homework with AI
Get the answers you need in no time with our AI-driven, step-by-step assistance
Get Started
Algebra And Trigonometry, Enhanced
Authors: Cynthia Y Young
4th Edition
1119320860, 9781119320869