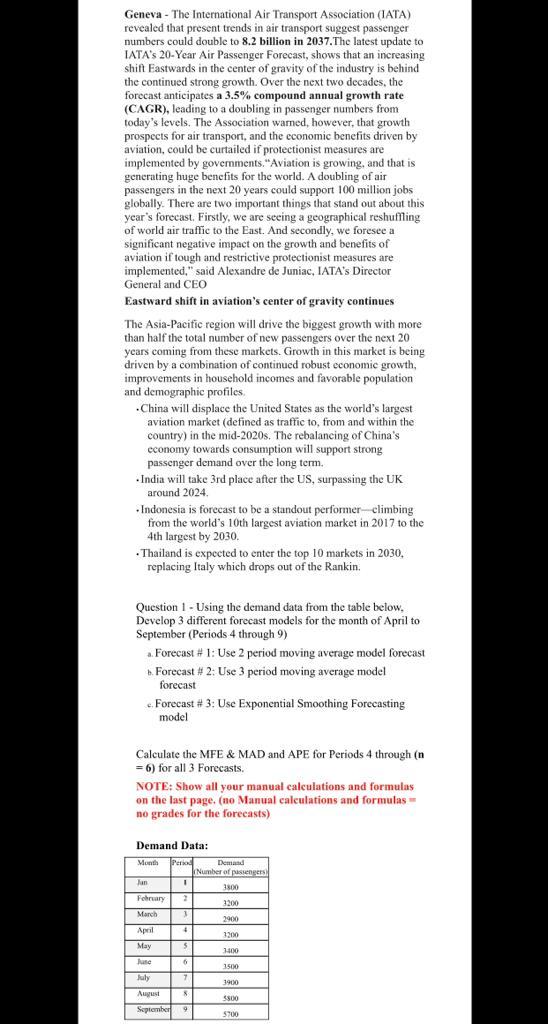
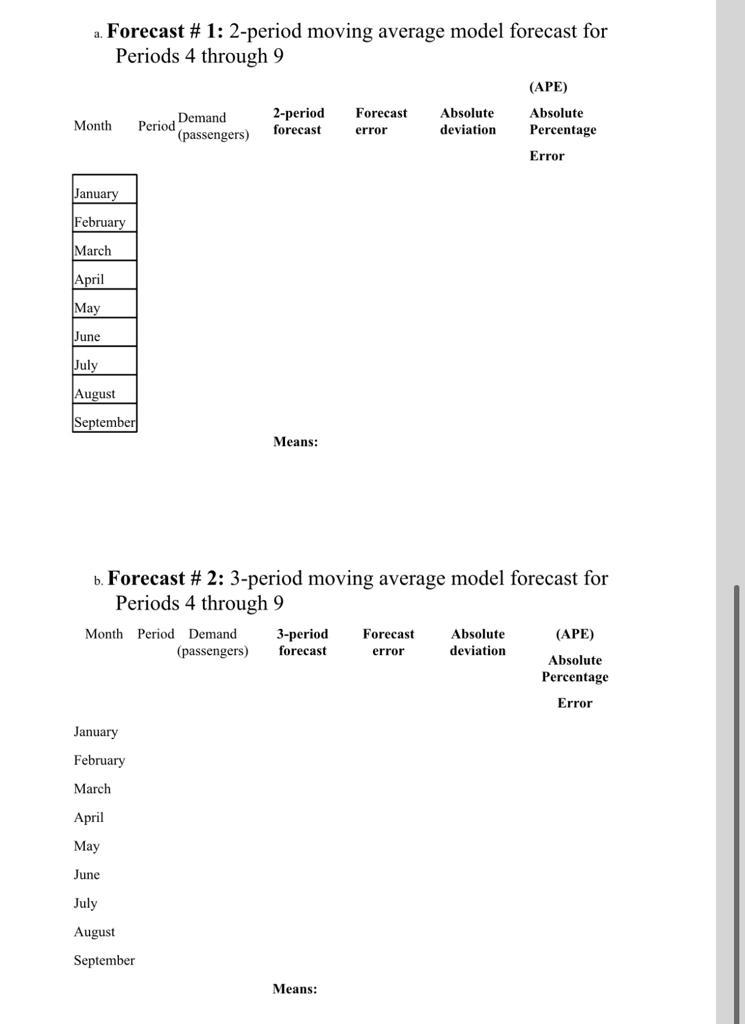
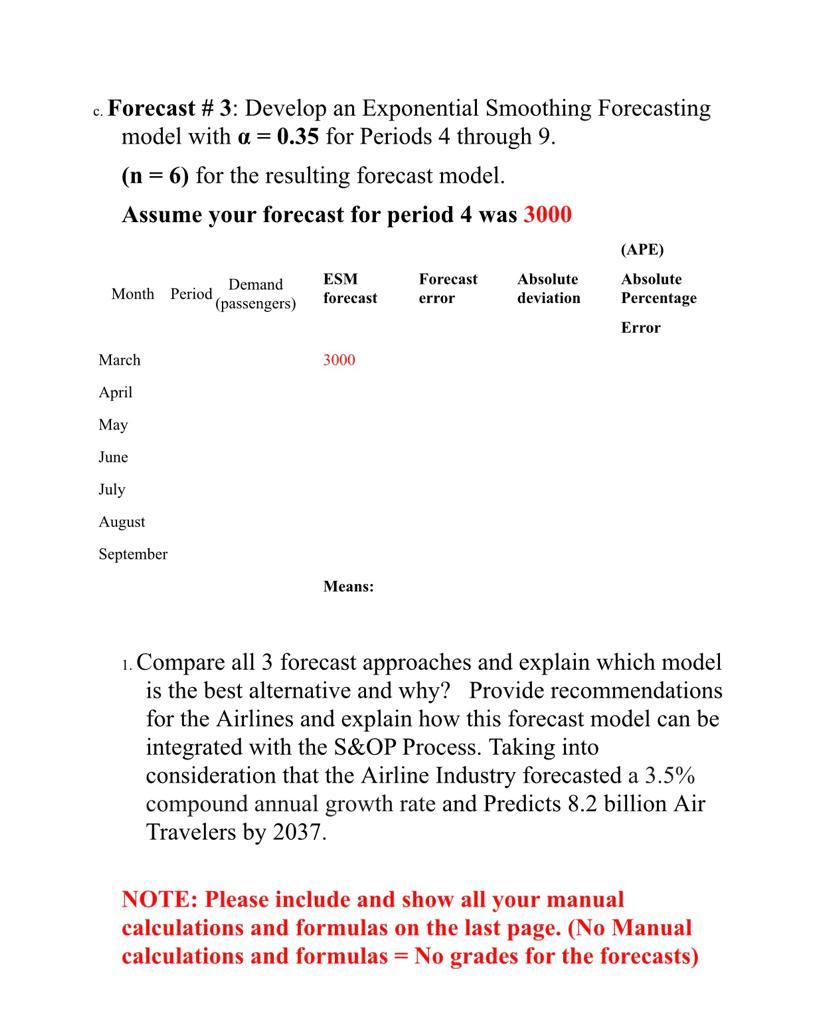
Geneva - The International Air Transport Association (IATA) revealed that present trends in air transport suggest passenger numbers could double to 8.2 billion in 2037. The latest update to IATA's 20-Year Air Passenger Forecast, shows that an increasing shift Eastwards in the center of gravity of the industry is behind the continued strong growth. Over the next two decades, the forecast anticipates a 3.5% compound annual growth rate (CAGR), leading to a doubling in passenger numbers from today's levels. The Association wamed, however, that growth prospects for air transport, and the economic benefits driven by aviation, could be curtailed if protectionist measures are implemented by governments."Aviation is growing, and that is generating huge benefits for the world. A doubling of air passengers in the next 20 years could support 100 million jobs globally. There are two important things that stand out about this year's forecast. Firstly, we are seeing a geographical reshuffling of world air traffic to the East. And secondly, we foresee a significant negative impact on the growth and benefits of aviation if tough and restrictive protectionist measures are implemented," said Alexandre de Juniac, IATA's Director General and CEO Eastward shift in aviation's center of gravity continues The Asia-Pacific region will drive the biggest growth with more than half the total number of new passengers over the next years coming from these markets. Growth in this market is being driven by a combination of continued robust economic growth, improvements in household incomes and favorable population and demographic profiles China will displace the United States as the world's largest aviation market (defined as traffic to, from and within the country) in the mid-2020s. The rebalancing of China's economy towards consumption will support strong passenger demand over the long term. India will take 3rd place after the US, surpassing the UK around 2024 Indonesia is forecast to be a standout performer climbing from the world's 10th largest aviation market in 2017 to the 4th largest by 2030. Thailand is expected to enter the top 10 markets in 2030, replacing Italy which drops out of the Rankin. Question 1 - Using the demand data from the table below. Develop 3 different forecast models for the month of April to September (Periods 4 through 9) . Forecast #1: Use 2 period moving average model forecast b. Forecast # 2: Use 3 period moving average model forecast Forecast #3: Use Exponential Smoothing Forecasting model Calculate the MFE & MAD and APE for Periods 4 through (n =6) for all 3 Forecasts. NOTE: Show all your manual calculations and formulas on the last page. (no Manual calculations and formulas no grades for the forecasts) Demand Data: Monte Persol Demand Number of passengers Jan 1 3800 Foruary 2 3200 March 3 2900 April 4 1200 May $ 100 June 6 1500 July 7 3900 August $800 September 9 5700 a. Forecast # 1: 2-period moving average model forecast for Periods 4 through 9 (APE) 2-period Forecast Absolute Absolute Month * (passengers) forecast deviation Percentage Error Period Demand error January February March April May June July August September Means: b. Forecast # 2: 3-period moving average model forecast for Periods 4 through 9 Month Period Demand 3-period Forecast Absolute (APE) (passengers) forecast deviation Absolute Percentage Error error January February March April May July August September Means: c. Forecast # 3: Develop an Exponential Smoothing Forecasting model with a = 0.35 for Periods 4 through 9. (n = 6) for the resulting forecast model. Assume your forecast for period 4 was 3000 (APE) Demand Month Period (passengers) ESM forecast Forecast error Absolute deviation Absolute Percentage Error March 3000 April May June July August September Means: 1. Compare all 3 forecast approaches and explain which model is the best alternative and why? Provide recommendations for the Airlines and explain how this forecast model can be integrated with the S&OP Process. Taking into consideration that the Airline Industry forecasted a 3.5% compound annual growth rate and Predicts 8.2 billion Air Travelers by 2037. NOTE: Please include and show all your manual calculations and formulas on the last page. (No Manual calculations and formulas = No grades for the forecasts) Geneva - The International Air Transport Association (IATA) revealed that present trends in air transport suggest passenger numbers could double to 8.2 billion in 2037. The latest update to IATA's 20-Year Air Passenger Forecast, shows that an increasing shift Eastwards in the center of gravity of the industry is behind the continued strong growth. Over the next two decades, the forecast anticipates a 3.5% compound annual growth rate (CAGR), leading to a doubling in passenger numbers from today's levels. The Association wamed, however, that growth prospects for air transport, and the economic benefits driven by aviation, could be curtailed if protectionist measures are implemented by governments."Aviation is growing, and that is generating huge benefits for the world. A doubling of air passengers in the next 20 years could support 100 million jobs globally. There are two important things that stand out about this year's forecast. Firstly, we are seeing a geographical reshuffling of world air traffic to the East. And secondly, we foresee a significant negative impact on the growth and benefits of aviation if tough and restrictive protectionist measures are implemented," said Alexandre de Juniac, IATA's Director General and CEO Eastward shift in aviation's center of gravity continues The Asia-Pacific region will drive the biggest growth with more than half the total number of new passengers over the next years coming from these markets. Growth in this market is being driven by a combination of continued robust economic growth, improvements in household incomes and favorable population and demographic profiles China will displace the United States as the world's largest aviation market (defined as traffic to, from and within the country) in the mid-2020s. The rebalancing of China's economy towards consumption will support strong passenger demand over the long term. India will take 3rd place after the US, surpassing the UK around 2024 Indonesia is forecast to be a standout performer climbing from the world's 10th largest aviation market in 2017 to the 4th largest by 2030. Thailand is expected to enter the top 10 markets in 2030, replacing Italy which drops out of the Rankin. Question 1 - Using the demand data from the table below. Develop 3 different forecast models for the month of April to September (Periods 4 through 9) . Forecast #1: Use 2 period moving average model forecast b. Forecast # 2: Use 3 period moving average model forecast Forecast #3: Use Exponential Smoothing Forecasting model Calculate the MFE & MAD and APE for Periods 4 through (n =6) for all 3 Forecasts. NOTE: Show all your manual calculations and formulas on the last page. (no Manual calculations and formulas no grades for the forecasts) Demand Data: Monte Persol Demand Number of passengers Jan 1 3800 Foruary 2 3200 March 3 2900 April 4 1200 May $ 100 June 6 1500 July 7 3900 August $800 September 9 5700 a. Forecast # 1: 2-period moving average model forecast for Periods 4 through 9 (APE) 2-period Forecast Absolute Absolute Month * (passengers) forecast deviation Percentage Error Period Demand error January February March April May June July August September Means: b. Forecast # 2: 3-period moving average model forecast for Periods 4 through 9 Month Period Demand 3-period Forecast Absolute (APE) (passengers) forecast deviation Absolute Percentage Error error January February March April May July August September Means: c. Forecast # 3: Develop an Exponential Smoothing Forecasting model with a = 0.35 for Periods 4 through 9. (n = 6) for the resulting forecast model. Assume your forecast for period 4 was 3000 (APE) Demand Month Period (passengers) ESM forecast Forecast error Absolute deviation Absolute Percentage Error March 3000 April May June July August September Means: 1. Compare all 3 forecast approaches and explain which model is the best alternative and why? Provide recommendations for the Airlines and explain how this forecast model can be integrated with the S&OP Process. Taking into consideration that the Airline Industry forecasted a 3.5% compound annual growth rate and Predicts 8.2 billion Air Travelers by 2037. NOTE: Please include and show all your manual calculations and formulas on the last page. (No Manual calculations and formulas = No grades for the forecasts)