

Answered step by step
Verified Expert Solution
Question
1 Approved Answer
give the code by using octave this is the final simulation z = new plot(t0) t=1 :0.01:5; Y(t)=.......... y=3*.........t.*cos(pi*t.^2); new_y = z = (mean y_new_y);
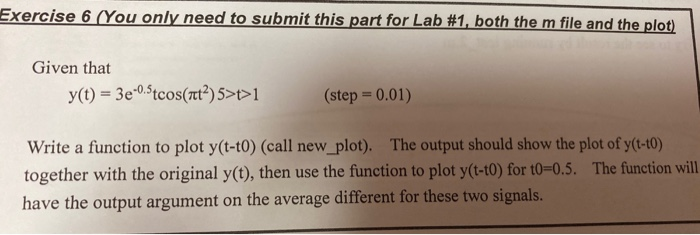
give the code by using octave
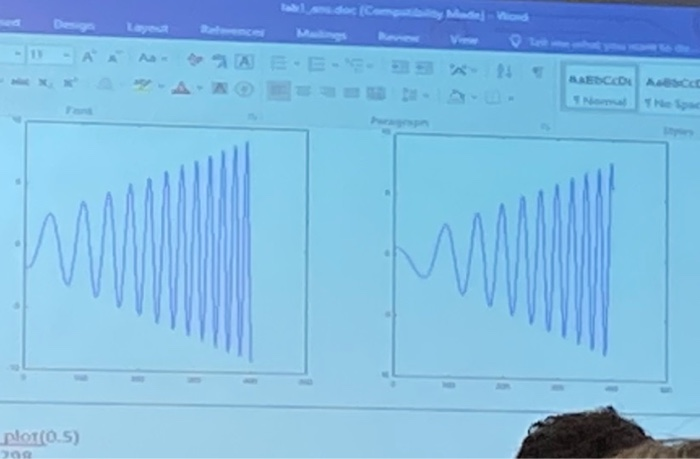
this is the final simulation
z = new plot(t0)
t=1 :0.01:5;
Y(t)=..........
y=3*.........t.*cos(pi*t.^2);
new_y =
z = (mean y_new_y);
this is the draft of the program, can give me a full and correct version??
Step by Step Solution
There are 3 Steps involved in it
Step: 1

Get Instant Access to Expert-Tailored Solutions
See step-by-step solutions with expert insights and AI powered tools for academic success
Step: 2

Step: 3
Ace Your Homework with AI
Get the answers you need in no time with our AI-driven, step-by-step assistance
Get Started
Advances In Databases And Information Systems 15th International Conference Adbis 2011 Vienna Austria September 2011 Proceedings Lncs 6909
Authors: Johann Eder ,Maria Bielikova ,A Min Tjoa
2011th Edition
3642237363, 978-3642237362