Answered step by step
Verified Expert Solution
Question
1 Approved Answer
Given the following points (x, y): (4,10), (5,13), (8, 44), (10,78), (13, 153) a. Draw a scatter plot of the data b. Use the

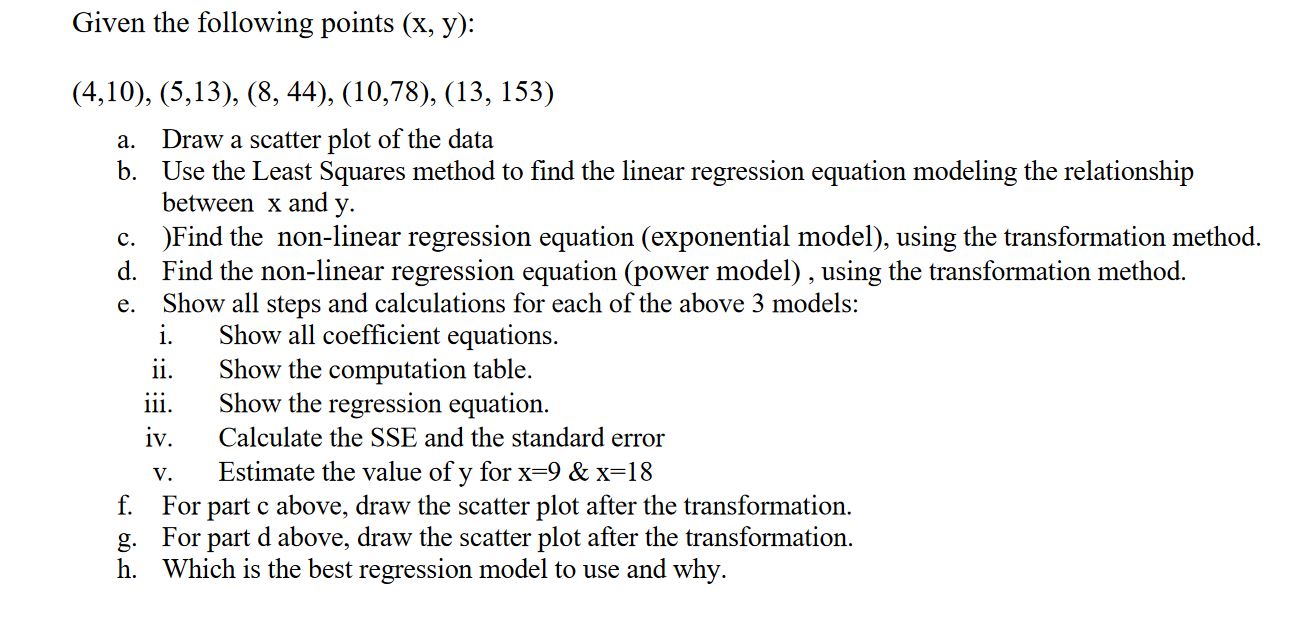
Given the following points (x, y): (4,10), (5,13), (8, 44), (10,78), (13, 153) a. Draw a scatter plot of the data b. Use the Least Squares method to find the linear regression equation modeling the relationship between x and y. c. )Find the non-linear regression equation (exponential model), using the transformation method. d. Find the non-linear regression equation (power model), using the transformation method. e. Show all steps and calculations for each of the above 3 models: Show all coefficient equations. i. ii. Show the computation table. Show the regression equation. Calculate the SSE and the standard error 111. iv. V. Estimate the value of y for x=9 & x=18 f. For part c above, draw the scatter plot after the transformation. For part d above, draw the scatter plot after the transformation. h. Which is the best regression model to use and why. g.
Step by Step Solution
★★★★★
3.45 Rating (155 Votes )
There are 3 Steps involved in it
Step: 1

Get Instant Access to Expert-Tailored Solutions
See step-by-step solutions with expert insights and AI powered tools for academic success
Step: 2

Step: 3

Ace Your Homework with AI
Get the answers you need in no time with our AI-driven, step-by-step assistance
Get Started


