

Question
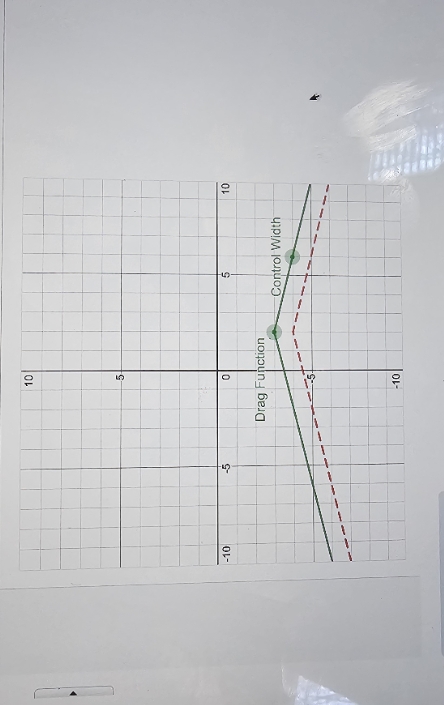
Given the graph of Y=f(x), shown as a red dashed curve, drag the green movable points to draw the graph of y=f(-x). Notice that you
Given the graph of Y=f(x), shown as a red dashed curve, drag the green movable points to draw the graph of y=f(-x). Notice that you can control the positioning of the reflection function with the coordinate labeled "Drag Function" and control the width of the reflection with the coordinate labeled "Control Width".
Step by Step Solution
There are 3 Steps involved in it
Step: 1

Get Instant Access to Expert-Tailored Solutions
See step-by-step solutions with expert insights and AI powered tools for academic success
Step: 2

Step: 3
Ace Your Homework with AI
Get the answers you need in no time with our AI-driven, step-by-step assistance
Get Started
Linear Algebra
Authors: Jim Hefferon
1st Edition
978-0982406212, 0982406215