Given the Income statement & Balance Sheet for one company
Calculate the following ( SHOWN IN HIGHLIGHT YELLOW COLOR ) , given in excel sheet .
Please show your work in order to understand
Business Assignment
 formulas
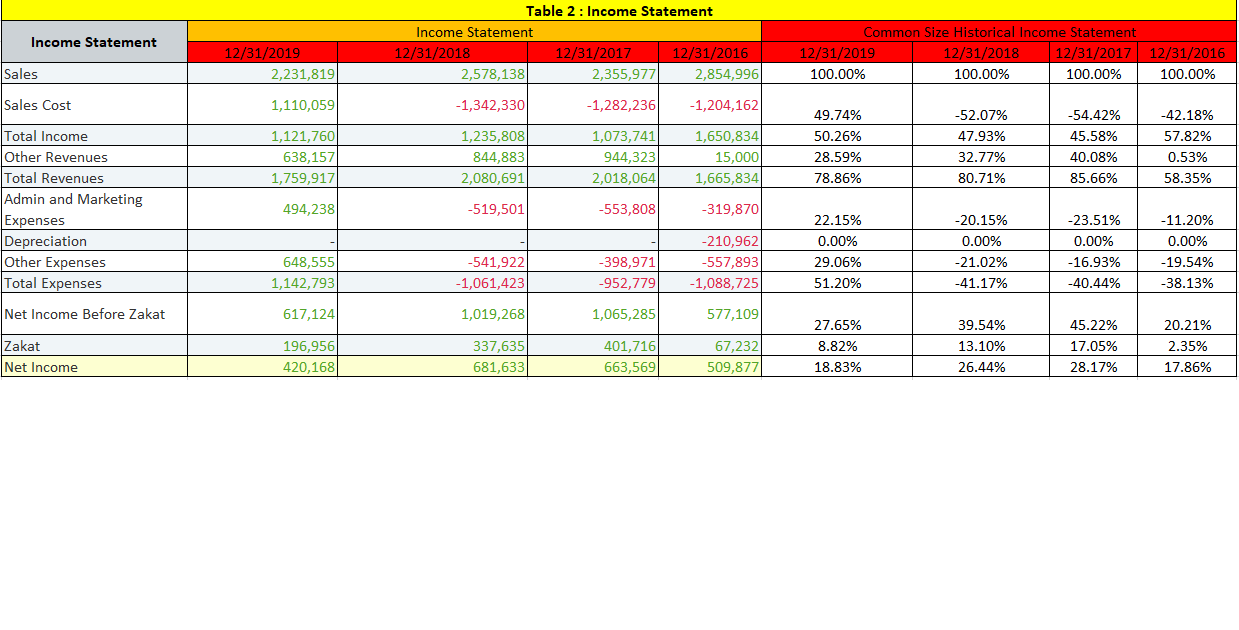
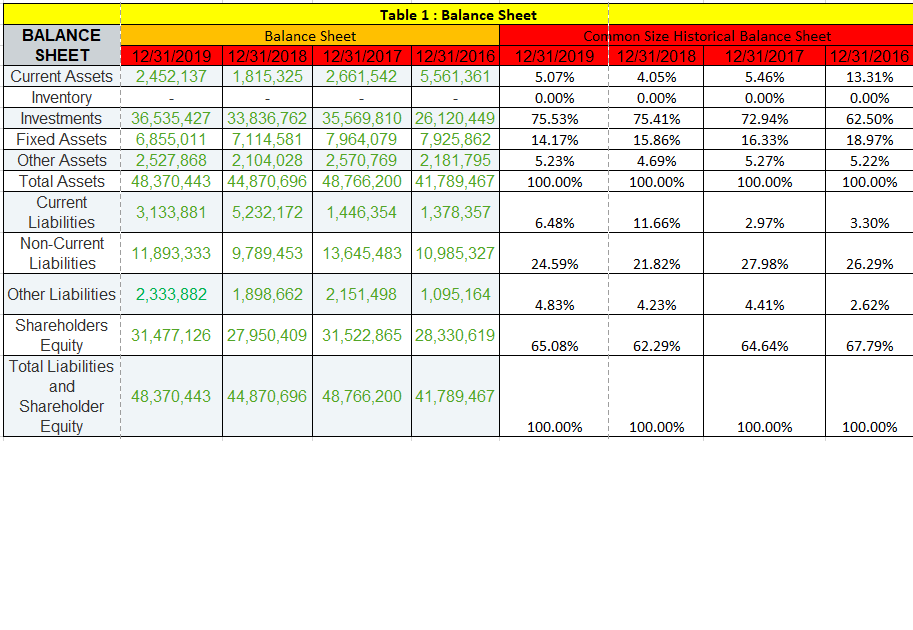
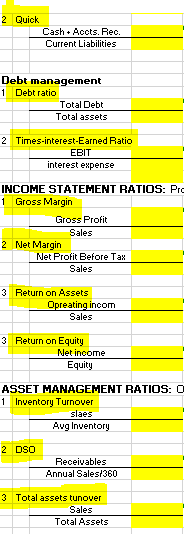
2 Quick Cash Acots. Reo Current Liabilities Debt management 1 Debt ratio Total Debt Total assets 2 Times-interest-Earned Ratio EBIT interest expense INCOME STATEMENT RATIOS: Pro 1 Gross Margin Gross Profit Sales 2 Net Margin Net Profit Before Tax Sales 3 Return on Assets Opreating incom Sales 3 Return on Equity Net income Equity ASSET MANAGEMENT RATIOS: O 1 Inventory Turnover slaes Avg Inventory 2 DSO Receivables Annual Sales/360 3 Total assets tunover Sales Total Assets Table 2: Income Statement Income Statement Income Statement Common Size Historical Income Statement 12/31/2019 12/31/2018 12/31/2017 12/31/2019 12/31/2018 12/31/2017 12/31/2016 12/31/2016 Sales 2,231,819 2,578,138 2,355,977 2,854,996 100.00% 100.00% 100.00% 100.00% Sales Cost 1,110,059 -1,342,330 -1,282,236 -1,204,162 49.74% -52.07% -54.42% -42.18% 1,235,808 1,073,741 50.26% 47.93% 45.58% 1,121,7601 638,157 57.82% 0.53% 844,883 1,650,834 15,000 1,665,834 28.59% 32.77% 944,323 2,018,064 40.08% 1,759,917 2,080,691 78.86% 80.71% 85.66% 58.35% Total Income Other Revenues Total Revenues Admin and Marketing Expenses Depreciation Other Expenses Total Expenses 494,238 -519,501 -553,808 -319,870 22.15% -20.15% -23.51% - 11.20% -210,962 0.00% 0.00% 0.00% 0.00% 648,555 -541,922 -398,971 -557,893 29.06% -21.02% -16.93% -19.54% 1,142,793 -1,061,423 -952,779 -1,088,725 51.20% -41.17% -40.44% -38.13% Net Income Before Zakat 617,124 1,019,268 1,065,285 577,109 27.65% 39.54% 45.22% 20.21% 337,635 8.82% 13.10% 17.05% 2.35% Zakat Net Income 196,956 420,168 401,716 663,569 67,232 509,877 681,633 18.83% 26.44% 28.17% 17.86% Table 1 : Balance Sheet BALANCE Balance Sheet Common Size Historical Balance Sheet SHEET 12/31/2019 12/31/2018 12/31/2017 12/31/2016 12/31/2019 12/31/2018 12/31/2017 12/31/2016 Current Assets 2,452,137 1,815,325 2,661,542 5,561,361 5.07% 4.05% 5.46% 13.31% Inventory 0.00% 0.00% 0.00% 0.00% Investments 36,535,427 33,836,762 35,569,810 26,120,449 75.53% 75.41% 72.94% 62.50% Fixed Assets 6,855,011 7,114,581 7,964,079 7,925,862 14.17% 15.86% 16.33% 18.97% Other Assets 2,527,868 2,104,028 2,570,769 2,181,795 5.23% 4.69% 5.27% 5.22% Total Assets 48,370,443 44,870,696 48,766,200 41,789,467 100.00% 100.00% 100.00% 100.00% Current 3,133,881 5,232,172 1,446,354 1,378,357 Liabilities 6.48% 11.66% 2.97% 3.30% Non-Current 11,893,333 9,789,453 13,645,483 10,985,327 Liabilities 24.59% 21.82% 27.98% 26.29% Other Liabilities 2,333,882 1,898,662 2,151,498 1,095,164 4.83% 4.23% 4.41% 2.62% 31,477,126 27,950,409 31,522,865 28,330,619 65.08% 62.29% 64.64% 67.79% Shareholders Equity Total Liabilities and Shareholder Equity 48,370,443 44,870,696 48,766,200 41,789,467 100.00% 100.00% 100.00% 100.00% 2 Quick Cash Acots. Reo Current Liabilities Debt management 1 Debt ratio Total Debt Total assets 2 Times-interest-Earned Ratio EBIT interest expense INCOME STATEMENT RATIOS: Pro 1 Gross Margin Gross Profit Sales 2 Net Margin Net Profit Before Tax Sales 3 Return on Assets Opreating incom Sales 3 Return on Equity Net income Equity ASSET MANAGEMENT RATIOS: O 1 Inventory Turnover slaes Avg Inventory 2 DSO Receivables Annual Sales/360 3 Total assets tunover Sales Total Assets Table 2: Income Statement Income Statement Income Statement Common Size Historical Income Statement 12/31/2019 12/31/2018 12/31/2017 12/31/2019 12/31/2018 12/31/2017 12/31/2016 12/31/2016 Sales 2,231,819 2,578,138 2,355,977 2,854,996 100.00% 100.00% 100.00% 100.00% Sales Cost 1,110,059 -1,342,330 -1,282,236 -1,204,162 49.74% -52.07% -54.42% -42.18% 1,235,808 1,073,741 50.26% 47.93% 45.58% 1,121,7601 638,157 57.82% 0.53% 844,883 1,650,834 15,000 1,665,834 28.59% 32.77% 944,323 2,018,064 40.08% 1,759,917 2,080,691 78.86% 80.71% 85.66% 58.35% Total Income Other Revenues Total Revenues Admin and Marketing Expenses Depreciation Other Expenses Total Expenses 494,238 -519,501 -553,808 -319,870 22.15% -20.15% -23.51% - 11.20% -210,962 0.00% 0.00% 0.00% 0.00% 648,555 -541,922 -398,971 -557,893 29.06% -21.02% -16.93% -19.54% 1,142,793 -1,061,423 -952,779 -1,088,725 51.20% -41.17% -40.44% -38.13% Net Income Before Zakat 617,124 1,019,268 1,065,285 577,109 27.65% 39.54% 45.22% 20.21% 337,635 8.82% 13.10% 17.05% 2.35% Zakat Net Income 196,956 420,168 401,716 663,569 67,232 509,877 681,633 18.83% 26.44% 28.17% 17.86% Table 1 : Balance Sheet BALANCE Balance Sheet Common Size Historical Balance Sheet SHEET 12/31/2019 12/31/2018 12/31/2017 12/31/2016 12/31/2019 12/31/2018 12/31/2017 12/31/2016 Current Assets 2,452,137 1,815,325 2,661,542 5,561,361 5.07% 4.05% 5.46% 13.31% Inventory 0.00% 0.00% 0.00% 0.00% Investments 36,535,427 33,836,762 35,569,810 26,120,449 75.53% 75.41% 72.94% 62.50% Fixed Assets 6,855,011 7,114,581 7,964,079 7,925,862 14.17% 15.86% 16.33% 18.97% Other Assets 2,527,868 2,104,028 2,570,769 2,181,795 5.23% 4.69% 5.27% 5.22% Total Assets 48,370,443 44,870,696 48,766,200 41,789,467 100.00% 100.00% 100.00% 100.00% Current 3,133,881 5,232,172 1,446,354 1,378,357 Liabilities 6.48% 11.66% 2.97% 3.30% Non-Current 11,893,333 9,789,453 13,645,483 10,985,327 Liabilities 24.59% 21.82% 27.98% 26.29% Other Liabilities 2,333,882 1,898,662 2,151,498 1,095,164 4.83% 4.23% 4.41% 2.62% 31,477,126 27,950,409 31,522,865 28,330,619 65.08% 62.29% 64.64% 67.79% Shareholders Equity Total Liabilities and Shareholder Equity 48,370,443 44,870,696 48,766,200 41,789,467 100.00% 100.00% 100.00% 100.00%