Answered step by step
Verified Expert Solution
Question
1 Approved Answer
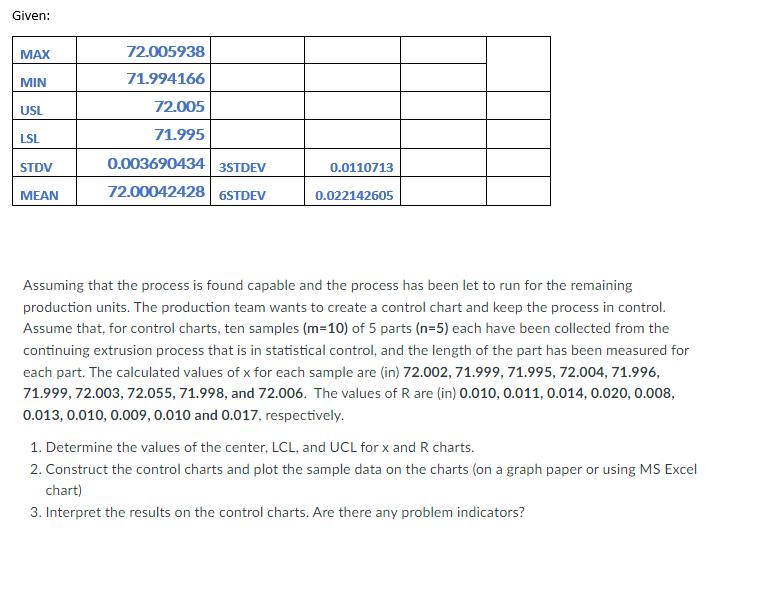
Given the information for a part's length of 72.0 and tolerance of +/-0.005 answer the following questions; Given: MAX MIN USL LSL STDV MEAN 72.005938
Given the information for a part's length of 72.0 and tolerance of +/-0.005 answer the following questions;

Given: MAX MIN USL LSL STDV MEAN 72.005938 71.994166 72.005 71.995 0.003690434 3STDEV 72.00042428 6STDEV 0.0110713 0.022142605 Assuming that the process is found capable and the process has been let to run for the remaining production units. The production team wants to create a control chart and keep the process in control. Assume that, for control charts, ten samples (m=10) of 5 parts (n=5) each have been collected from the continuing extrusion process that is in statistical control, and the length of the part has been measured for each part. The calculated values of x for each sample are (in) 72.002, 71.999, 71.995, 72.004, 71.996, 71.999,72.003, 72.055, 71.998, and 72.006. The values of R are (in) 0.010, 0.011, 0.014, 0.020, 0.008, 0.013, 0.010, 0.009, 0.010 and 0.017, respectively. 1. Determine the values of the center, LCL, and UCL for x and R charts. 2. Construct the control charts and plot the sample data on the charts (on a graph paper or using MS Excel chart) 3. Interpret the results on the control charts. Are there any problem indicators?
Step by Step Solution
★★★★★
3.52 Rating (149 Votes )
There are 3 Steps involved in it
Step: 1
Question According to given data 1 First we need Xdbar 72002719997199572004719967...
Get Instant Access to Expert-Tailored Solutions
See step-by-step solutions with expert insights and AI powered tools for academic success
Step: 2

Step: 3

Ace Your Homework with AI
Get the answers you need in no time with our AI-driven, step-by-step assistance
Get Started


