Answered step by step
Verified Expert Solution
Question
1 Approved Answer
: Go to FRED database at https://fred.stlouisfed.org and search for the following data: Real Personal Consumption Expenditures, Real Gross Private Domestic Investment, and Real


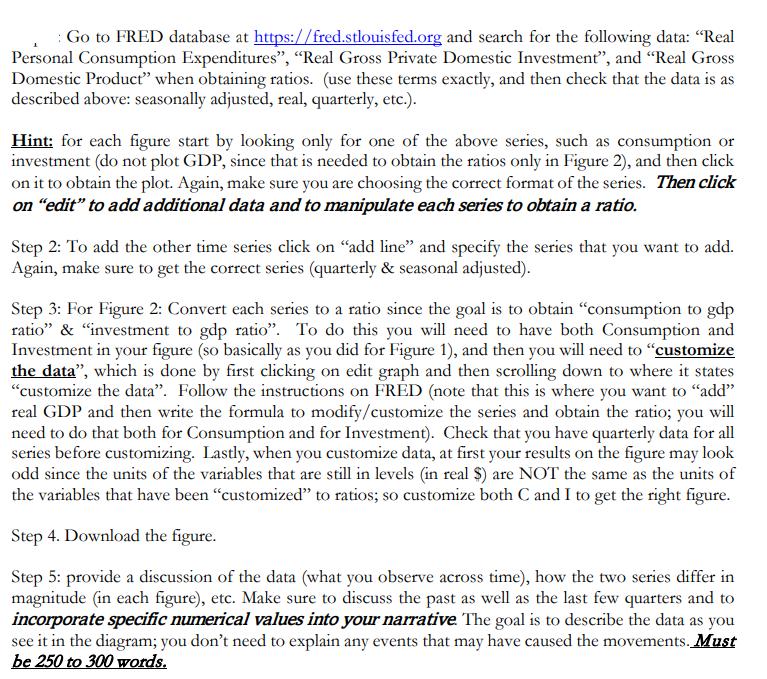
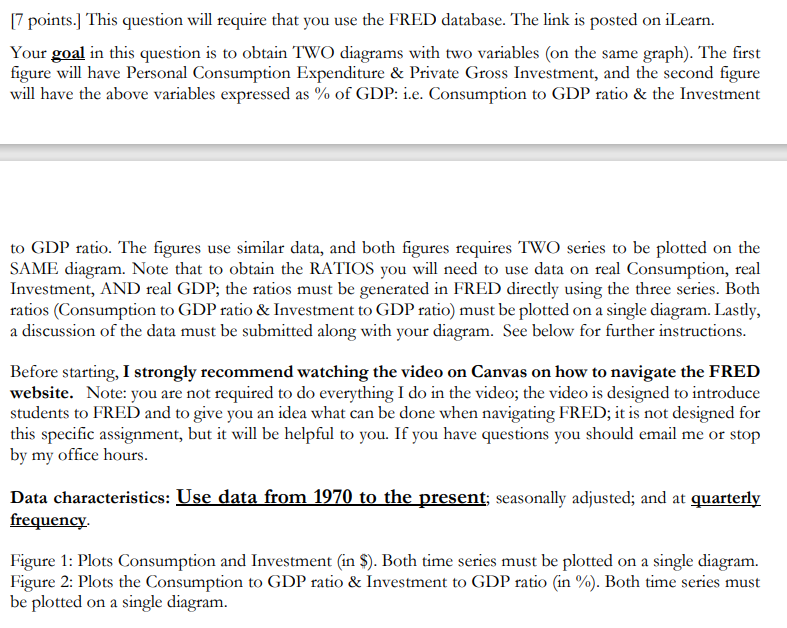
: Go to FRED database at https://fred.stlouisfed.org and search for the following data: "Real Personal Consumption Expenditures", "Real Gross Private Domestic Investment", and "Real Gross Domestic Product" when obtaining ratios. (use these terms exactly, and then check that the data is as described above: seasonally adjusted, real, quarterly, etc.). Hint: for each figure start by looking only for one of the above series, such as consumption or investment (do not plot GDP, since that is needed to obtain the ratios only in Figure 2), and then click on it to obtain the plot. Again, make sure you are choosing the correct format of the series. Then click on "edit" to add additional data and to manipulate each series to obtain a ratio. Step 2: To add the other time series click on "add line" and specify the series that you want to add. Again, make sure to get the correct series (quarterly & seasonal adjusted). Step 3: For Figure 2: Convert each series to a ratio since the goal is to obtain "consumption to gdp ratio" & "investment to gdp ratio". To do this you will need to have both Consumption and Investment in your figure (so basically as you did for Figure 1), and then you will need to "customize the data", which is done by first clicking on edit graph and then scrolling down to where it states "customize the data". Follow the instructions on FRED (note that this is where you want to "add" real GDP and then write the formula to modify/customize the series and obtain the ratio; you will need to do that both for Consumption and for Investment). Check that you have quarterly data for all series before customizing. Lastly, when you customize data, at first your results on the figure may look odd since the units of the variables that are still in levels (in real $) are NOT the same as the units of the variables that have been "customized" to ratios; so customize both C and I to get the right figure. Step 4. Download the figure. Step 5: provide a discussion of the data (what you observe across time), how the two series differ in magnitude (in each figure), etc. Make sure to discuss the past as well as the last few quarters and to incorporate specific numerical values into your narrative. The goal is to describe the data as you see it in the diagram; you don't need to explain any events that may have caused the movements. Must be 250 to 300 words. [7 points.] This question will require that you use the FRED database. The link is posted on iLearn. Your goal in this question is to obtain TWO diagrams with two variables (on the same graph). The first figure will have Personal Consumption Expenditure & Private Gross Investment, and the second figure will have the above variables expressed as % of GDP: i.e. Consumption to GDP ratio & the Investment to GDP ratio. The figures use similar data, and both figures requires TWO series to be plotted on the SAME diagram. Note that to obtain the RATIOS you will need to use data on real Consumption, real Investment, AND real GDP; the ratios must be generated in FRED directly using the three series. Both ratios (Consumption to GDP ratio & Investment to GDP ratio) must be plotted on a single diagram. Lastly, a discussion of the data must be submitted along with your diagram. See below for further instructions. Before starting, I strongly recommend watching the video on Canvas on how to navigate the FRED website. Note: you are not required to do everything I do in the video; the video is designed to introduce students to FRED and to give you an idea what can be done when navigating FRED; it is not designed for this specific assignment, but it will be helpful to you. If you have questions you should email me or stop by my office hours. Data characteristics: Use data from 1970 to the present; seasonally adjusted; and at quarterly frequency. Figure 1: Plots Consumption and Investment (in $). Both time series must be plotted on a single diagram. Figure 2: Plots the Consumption to GDP ratio & Investment to GDP ratio (in %). Both time series must be plotted on a single diagram.
Step by Step Solution
There are 3 Steps involved in it
Step: 1

Get Instant Access to Expert-Tailored Solutions
See step-by-step solutions with expert insights and AI powered tools for academic success
Step: 2

Step: 3

Ace Your Homework with AI
Get the answers you need in no time with our AI-driven, step-by-step assistance
Get Started


