Answered step by step
Verified Expert Solution
Question
1 Approved Answer
GOODMAN PRICE DIVIDEND LANDRY PRICE MARKET INDEX DIVIDEND 2020 2019 2018 2017 2016 2015 30.32 23.53 28.61 15.21 12.63 13.21 2.23 2.65 2.73 2.57 2.23
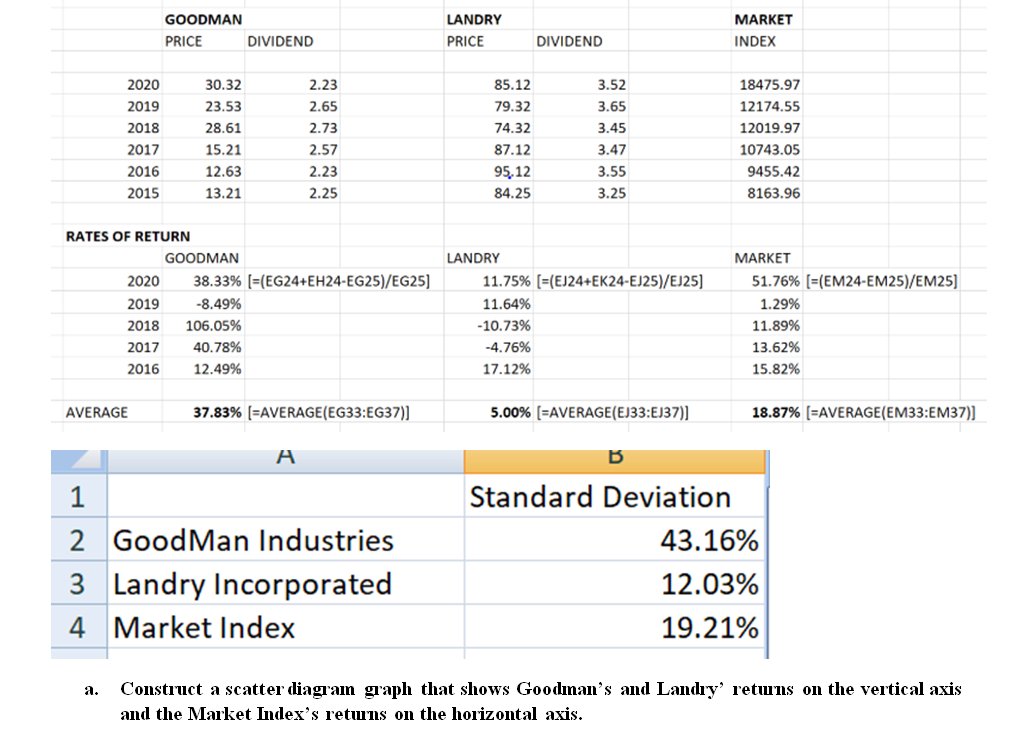
GOODMAN PRICE DIVIDEND LANDRY PRICE MARKET INDEX DIVIDEND 2020 2019 2018 2017 2016 2015 30.32 23.53 28.61 15.21 12.63 13.21 2.23 2.65 2.73 2.57 2.23 2.25 85.12 79.32 74.32 87.12 95.12 84.25 3.52 3.65 3.45 3.47 3.55 3.25 18475.97 12174.55 12019.97 10743.05 9455.42 8163.96 RATES OF RETURN GOODMAN 2020 38.33% (=(EG24+EH24-EG25)/EG25) -8.49% 2018 106.05% 2017 40.78% 2016 12.49% 2019 LANDRY 11.75% (=(EJ24+EK24-EJ25)/EJ25) 11.64% -10.73% -4.76% 17.12% MARKET 51.76% (=(EM24-EM25)/EM25) 1.29% 11.89% 13.62% 15.82% AVERAGE 37.83% (=AVERAGE(EG33:EG37)] 5.00% (=AVERAGE(EJ33:EJ37)] 18.87% (=AVERAGE(EM33:EM37)] A B 1 2 Good Man Industries 3 Landry Incorporated 4 Market Index Standard Deviation 43.16% 12.03% 19.21% a. Construct a scatter diagram graph that shows Goodman's and Landy' returns on the vertical axis and the Market Index's returns on the horizontal axis
Step by Step Solution
There are 3 Steps involved in it
Step: 1
Get Instant Access to Expert-Tailored Solutions
See step-by-step solutions with expert insights and AI powered tools for academic success
Step: 2
Step: 3
Ace Your Homework with AI
Get the answers you need in no time with our AI-driven, step-by-step assistance
Get Started