Question
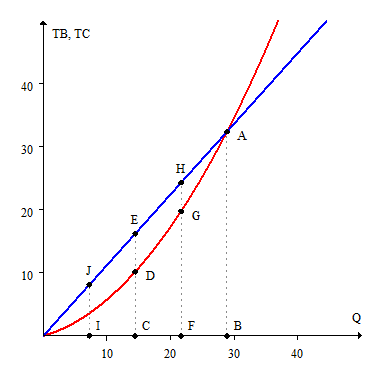
Graph of TB & TC of Hours Working : The graph below measures salary (thousands per year) and perceived costs from working for a single
Graph of TB & TC of Hours Working: The graph below measures salary (thousands per year) and perceived costs from working for a single worker. The worker perceives their total cost equation for working to beTC =. The horizontal axis measures the hours of working per week that they can choose, giving them a total benefit of working equation,TB =. (For hours beyond 40, assume thatTC>TB.)
For the question below, use the following table in conjunction with the Figure:Graph of TB & TC of Hours Working.
Point Q TB TC NB MC
I 7.215 8.102
C 14.43 10.170 6.039 1.123
F 21.65
B 28.86 32.410 1.960
Which of the points corresponds to where the NB is zero?
A. I
B. B
C. C
D. F
E. None of the above

Step by Step Solution
There are 3 Steps involved in it
Step: 1

Get Instant Access to Expert-Tailored Solutions
See step-by-step solutions with expert insights and AI powered tools for academic success
Step: 2

Step: 3

Ace Your Homework with AI
Get the answers you need in no time with our AI-driven, step-by-step assistance
Get Started


