

Global Company Net Data Year Ticker Assets. Income Sales Industry Classificat 1 Key Data Date Fiscal Symbol Total (Loss) (Net) lon Code 2 116104
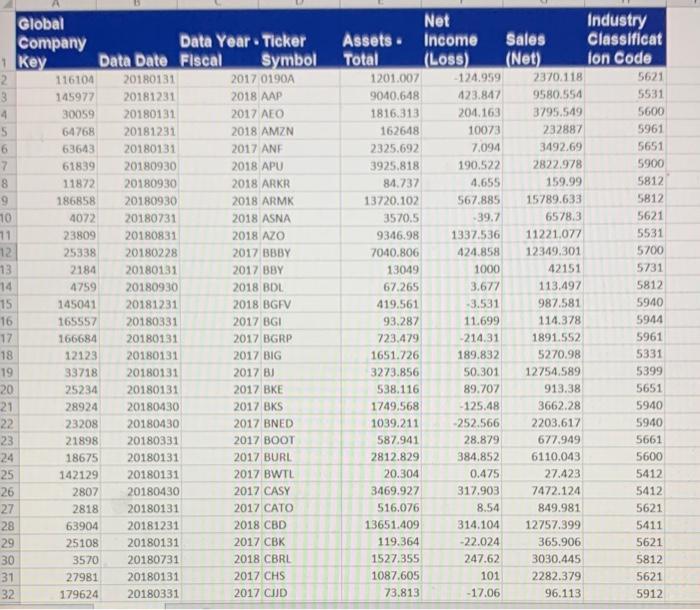
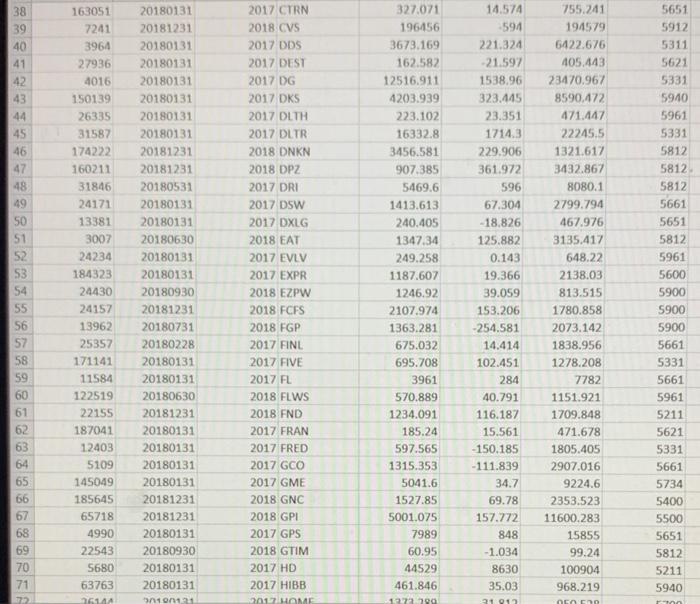
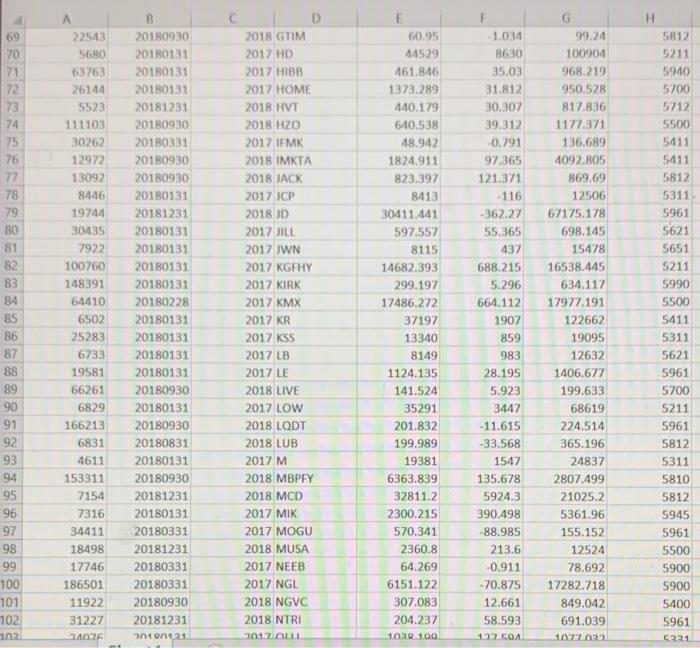
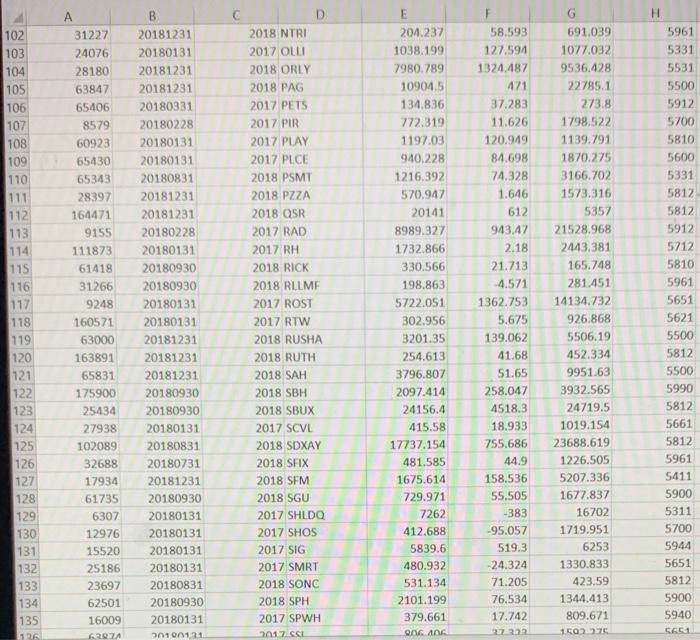
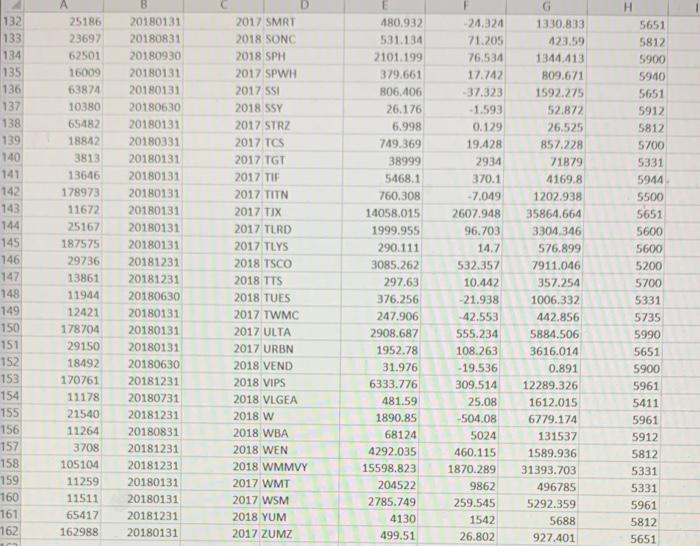
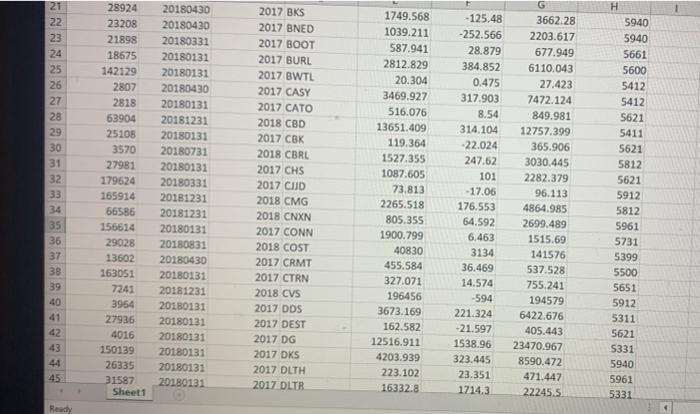
Global Company Net Data Year Ticker Assets. Income Sales Industry Classificat 1 Key Data Date Fiscal Symbol Total (Loss) (Net) lon Code 2 116104 20180131 2017 0190A 1201.007 -124.959 2370.118 5621 3 145977 20181231 2018 AAP 9040.648 423.847 9580.554 5531 4 30059 20180131 2017 AEO 1816.313 204.163 3795.549 5600 S 64768 20181231 2018 AMZN 162648 10073 232887 5961 6 63643 20180131 2017 ANF 2325.692 7.094 3492.69 5651 7 61839 20180930 2018 APU 3925.818 190.522 2822.978 5900 8 11872 20180930 2018 ARKR 84.737 9 186858 20180930 2018 ARMK 13720.102 4.655 567.885 159.99 5812 15789.633 5812 10 4072 20180731 2018 ASNA 3570.5 11 23809 20180831 2018 AZO 9346.98 -39.7 1337.536 6578.3 5621 11221.077 5531 12 25338 20180228 2017 BBBY 7040.806 424.858 12349.301 5700 13 2184 20180131 2017 BBY 13049 1000 42151 5731 14 4759 20180930 2018 BDL 67.265 3.677 113.497 5812 15 145041 20181231 2018 BGFV 419.561 -3.531 987.581 5940 16 165557 20180331 2017 BGI 93.287 11.699 114.378) 5944 17 166684 20180131 2017 BGRP 723.479 -214.31 1891.552) 5961 18 12123 20180131 2017 BIG 1651.726 189.832 5270.98 5331 19 33718 20180131 2017 BJ 3273.856 50.301 12754.589 5399 20 25234 20180131 2017 BKE 538.116 89.707 913.38 5651 21 28924 20180430 2017 BKS 1749.568 -125.48 3662.28 5940 22 23208 20180430 2017 BNED 1039.211 -252.566 2203.617 5940 23 21898 20180331 2017 BOOT 587.941 28.879 677.949 5661 24 18675 20180131 2017 BURL 2812.829 384.852 6110.043 5600 25 142129 20180131 2017 BWTL 20.304 26 2807 20180430 2017 CASY 3469.927 0.475 317.903 27.423 5412 7472.124 5412 27 2818 20180131 2017 CATO 516.076 8.54 849.981 5621 28 63904 20181231 2018 CBD 13651.409 314.104 12757.399 5411 29 25108 20180131 2017 CBK 119.364 -22.024 365.906 5621 30 3570 20180731 2018 CBRL 1527.355 247.62 3030,445 5812 31 27981 20180131 2017 CHS 1087.605 101 2282.379 5621 32 179624 20180331 2017 CJJD 73.813 -17.06 96.113 5912 38 163051 20180131 2017 CTRN 327.071 14.574 755.241 5651 39 7241 20181231 2018 CVS 196456 594 194579 5912 40 3964 20180131 2017 DDS 3673.169 221.324 6422.676 5311 41 27936 20180131 2017 DEST 162.582 -21.597 405.443 5621 42 4016 20180131 2017 DG 12516.911 1538.96 23470.967 5331 43 150139 20180131 2017 DKS 4203.939 323.445 8590.472 5940 44 26335 20180131 2017 DLTH 223.102 23.351 471.447 5961 45 31587 20180131 2017 DLTR 16332.8 1714.3 22245.5 5331 46 174222 20181231 2018 DNKN 3456.581 229.906 1321.617 5812 47 160211 20181231 2018 DPZ 907.385 361.972 3432.867 5812 48 31846 20180531 2017 DRI 5469.6 596 8080.1 5812 49 24171 20180131 2017 DSW 1413.613 67.304 2799.794 5661 50 13381 20180131 2017 DXLG 240.405 -18.826 467.976 5651 51 3007 20180630 2018 EAT 1347.34 125.882 3135.417 5812 52 24234 20180131 2017 EVLV 249.258 0.143 648.22 5961 53 184323 20180131 2017 EXPR 1187.607 19.366 2138.03 5600 54 24430 20180930 2018 EZPW 1246.92 39.059 813.515 5900 55 24157 20181231 2018 FCFS 2107.974 153.206 1780.858 5900 56 13962 20180731 2018 FGP 1363.281 -254.581 2073.142 5900 57 25357 20180228 2017 FINL 675.032 14.414 1838.956 5661 58 171141 20180131 2017 FIVE 695.708 102.451 1278.208 5331 59 11584 20180131 2017 FL 3961 284 7782 5661 60 122519 20180630 2018 FLWS 570.889 40.791 1151.921 5961 61 22155 20181231 2018 FND 1234.091 116.187 1709.848 5211 62 187041 20180131 2017 FRAN 185.24 15.561 471.678 5621 63 12403 20180131 2017 FRED 597.565 -150.185 1805.405 5331 64 5109 20180131 2017 GCO 1315.353 -111.839 2907.016 5661 65 145049 20180131 2017 GME 5041.6 34.7 9224.6 5734 66 185645 20181231 2018 GNC 1527.85) 69.78 2353.523 5400 67 65718 20181231 2018 GPI 5001.075 68 4990 20180131 2017 GPS 7989 69 22543 20180930 2018 GTIM 60.95 157.772 848 -1.034 11600.283 5500 15855 5651 99.24 5812 70 5680 20180131 2017 HD 44529 71 63763 20180131 2017 HIBB 461.846 8630 35.03 100904 5211 968.219 5940 72 36144 301901.31 2017 HOME 1373.799 31 9132 050 500 r700 B C D F G H 69 22543) 20180930 2018 GTIM 60.95 -1.034 99.24 5812 70 5680 20180131 2017 HD 44529 8630 100904 5211 71 63763 20180131 2017 HIBB 461.846 35.03 968.219 5940 72 26144 20180131 2017 HOME 1373.289 31.812 950.528 5700 73 5523 20181231 2018 HVT 440.179 30.307 817.836 5712 74 111103 20180930 2018 HZO 640.538 39.312 1177.371 5500 75 30262 20180331 2017 IFMK 48.942 -0.791 136.689 5411 76 12972 20180930 2018 IMKTA 1824.911 97.365 4092.805 5411 77 13092 20180930 2018 JACK 823.397 121.371 869.69 5812 78 8446 20180131 2017 JCP 8413 -116 12506 5311 79 19744 20181231 80 30435 20180131 81 7922 20180131 82 100760 20180131 2018 JD 2017 JILL 2017 JWN 2017 KGFHY 30411.441 -362.27 67175.178 5961 597.557 8115 55.365 698.145 5621 437 15478 5651 14682.393 688.215 16538.445 5211 83 148391 20180131 2017 KIRK 299.197 5.296 634.117 5990 84 64410 20180228 2017 KMX 17486.272 664.112 17977.191 5500 85 6502 20180131 2017 KR 37197 1907 122662 5411 86 25283 20180131 2017 KSS 13340 859 19095 5311 87 6733 20180131 2017 LB 8149 983 12632 5621 88 19581 20180131 2017 LE 1124.135 28.195 1406.677 5961 89 66261 20180930 2018 LIVE 141.524 5.923 199.633 5700 90 6829 20180131 2017 LOW 35291 3447 68619 5211 91 166213 20180930 2018 LQDT 201.832 -11.615 224.514 5961 92 6831 20180831 2018 LUB 199.989 -33.568 365.196 5812 93 4611 20180131 2017 M 19381 1547 24837 5311 94 153311 20180930 2018 MBPFY 6363.839. 135.678 2807.499 5810 95 7154 20181231 2018 MCD 32811.2 5924.3 21025.2 5812 96 7316 20180131 2017 MIK 2300.215 390.498 5361.96 5945 97 34411 20180331 2017 MOGU 570.341 -88.985 155.152 5961 98 18498 20181231 2018 MUSA 2360.8 213.6 12524 5500 99 17746 20180331 2017 NEEB 64.269 -0.911 78.692 5900 100 186501 20180331 2017 NGL 6151.122 -70.875 17282.718 5900 101 11922 20180930 2018 NGC 307.083 12.661 849.042 5400 102 31227 20181231 2018 NTRI 204.237 58.593 691.039 5961 102 24036 20180121 2017 OUL 1030 100 127.504 1077032 5231 A B C D E G H 102 31227 20181231 2018 NTRI 204.237 58.593 691.039 5961 103 24076 20180131 2017 OLLI 1038.199 127.594 1077.032 5331 104 28180 20181231 2018 ORLY 7980.789 1324.487 9536.428 5531 105 63847 20181231 2018 PAG 10904.5 471 22785.1 5500 106 65406 20180331 2017 PETS 134.836 37.283 273.8 5912 107 8579 20180228 2017 PIR 772.319 11.626 1798.522 5700 108 60923 20180131 2017 PLAY 1197.03 120.949 1139.791 5810 109 65430 20180131 2017 PLCE 940.228 84.698 1870.275 5600 110 65343 20180831 2018 PSMT 1216.392 74.328 3166.702 5331 111 28397 20181231 2018 PZZA 570.947 1.646 1573.316 5812 112 164471 20181231 2018 QSR 20141 612 5357 5812 113 9155 20180228 2017 RAD 8989.327 943.47 21528.968 5912 114 111873 20180131 2017 RH 1732.866 2.18 2443.381 5712 115 61418 20180930 2018 RICK 330.566 21.713 165.748 5810 116 31266 20180930 2018 RLLMF 198.863) 4.571 281.451 5961 117 9248 20180131 2017 ROST 5722.051 1362.753 14134.7321 5651 118 160571 20180131 2017 RTW 302.956 5.675 926.868 5621 119 63000 20181231 2018 RUSHA 3201.35 139.062 5506.19 5500 120 163891 20181231 2018 RUTH 254.613 41.68 452.334 5812 121 65831 20181231 2018 SAH 3796.807 51.65 9951.63 5500 122 175900 20180930 2018 SBH 2097.414 258.047 3932.565 5990 123 25434 20180930 2018 SBUX 24156.4 4518.3 24719.5 5812 124 27938 20180131 2017 SCVL 415.58 18.933 1019.154 5661 125 102089 20180831 2018 SDXAY 17737.154 755.686 23688.619 5812 126 32688 20180731 2018 SFIX 481.585 44.9 1226.505 5961 127 17934 20181231 2018 SFM 1675.614 158.536 5207.336 5411 128 61735 20180930 2018 SGU 729.971 55.505 1677.837 5900 129 6307 20180131 2017 SHLDQ 7262 -383 16702 5311 130 12976 20180131 2017 SHOS 412.688 -95.057 1719.951 5700 131 15520 20180131 2017 SIG 5839.6 519.3 6253 5944 132 25186 20180131 2017 SMRT 480.932 -24.324 1330.833 5651 133 23697 20180831 2018 SONC 531.134 71.205 423.59 5812 134 62501 20180930 2018 SPH 2101.199 76.534 1344.413 5900 135 16009 20180131 2017 SPWH 379.661 17.742 809.671 5940 63871 001901,31 2017 SSL 906 406 37 332 1502 375 5651 E G H 132 25186 20180131 2017 SMRT 480.932 -24.324 1330.833 5651 133 23697 20180831 2018 SONC 531.134 71.205 423.59 5812 134 62501 20180930 2018 SPH 2101.199 76.534 1344.413 5900 135 16009 20180131 2017 SPWH 379.661 17.742 809.671 5940 136 63874 20180131 2017 SSI 806.406 -37.323 1592.275 5651 137 10380 20180630) 2018 SSY 26.176 -1.593 52.872 5912 138 65482 20180131 2017 STRZ 6.998 0.129 26.525 5812 139 18842 20180331 2017 TCS 749.369 19.428 857.228 5700 140 3813 20180131 2017 TGT 38999 2934 71879 5331 141 13646 20180131 2017 TIF 5468.1 370.1 4169.8 5944 142 178973 20180131 2017 TITN 760.308 -7.049 1202.938 5500 143 11672 20180131 2017 TIX 14058.015 2607.948 35864.664 5651 144 25167 20180131 2017 TLRD 1999.955 96.703 3304.346 5600 145 187575 20180131 2017 TLYS 290.111 14.7 576.899 5600 146 29736 20181231 2018 TSCO 3085.262 532.357 7911.046) 5200 147 13861 20181231 2018 TTS 297.63 10.442 357.254 5700 148 11944 20180630 2018 TUES 376.256 -21.938 1006.332 5331 149 12421 20180131 2017 TWMC 247.906 -42.553 442.856 5735 150 178704 20180131 2017 ULTA 2908.687 555.234 5884.506 5990 151 29150 20180131 2017 URBN 1952.78 108.263 3616.014 5651 152 18492 20180630 2018 VEND 31.976 -19.536 0.891 5900 153 170761 20181231 2018 VIPS 6333.776 309.514 12289.326 5961 154 11178 20180731 2018 VLGEA 481.59 25.08 1612.015 5411 155 21540 20181231 2018 W 1890.85 -504.08 6779.174 5961 156 11264 20180831 2018 WBA 68124 5024 131537 5912 157 3708 20181231 2018 WEN 4292.035 460.115 1589.936 5812 158 105104 20181231 2018 WMMVY 15598.823 1870.289 31393.703 5331 159 11259 20180131 2017 WMT 204522 160 11511 20180131 2017 WSM 2785.749 161 65417 20181231 2018 YUM 4130 162 162988 20180131 2017 ZUMZ 499.51 9862 259.545 1542 26.802 496785 5331 5292.359 5961 5688 5812 927.401 5651 Required: 1. What is the mean Net Income for 2018 for the retail industry ($ millions)? O 2,106.87 O 15,379.43 O 8,695.32 O 544.346 13 2. What is the mean Sales (net) for 2018 for the retail industry ($ millions)? O 15,379.43 O 2,106.87 O 544.346 O 8,695.32 es 3. Which is more likely to be negative? Sales (net) or net income? O Net Income O Sales (net) 13 4. Which observation is the outlier for return on sales? O-0.07 O 0.29 0-0.10 O-21.93 5. What is the maximum net income achieved in 2018 for the retail industry ($ millions)? O 496,785 O 10,073 O 204,522 O 9,667 G H 2222222 21 28924 20180430 2017 BKS 1749.568 -125.48 3662.28 5940 23208 20180430 2017 BNED 1039.211 -252.566 2203.617 5940 23 21898 20180331 2017 BOOT 587.941 28.879 677.949 5661 24 18675 20180131 2017 BURL 2812.829 384.852 6110.043 5600 25 142129 20180131 2017 BWTL 20.304 0.475 27.423 5412 26 2807 20180430 2017 CASY 3469.927 317.903 7472.124 5412 27 2818 20180131 2017 CATO 516.076 8.54 849.981 5621 28 63904 20181231 2018 CBD 13651.409 314.104 12757.399 5411 29 25108 20180131 2017 CBK 119.364 -22.024 365.906 5621 30 3570 20180731 2018 CBRL 1527.355 247.62 3030.445 5812 31 27981 20180131 2017 CHS 1087.605 101 2282.379 5621 32 179624 20180331 2017 CJJD 73.813 -17.06 96.113 5912 33 165914 20181231 2018 CMG 2265.518 176.553 4864.985 5812 34 66586 20181231 2018 CNXN 805.355 64.592 2699.489 5961 35 156614 20180131 2017 CONN 1900.799 6.463 1515.69 5731 36 29028 20180831 2018 COST 40830 3134 141576 5399 37 13602 20180430 2017 CRMT 455.584 36.469 537.528 5500 38 163051 20180131 2017 CTRN 327.071 14.574 755.241 5651 39 7241 20181231 2018 CVS 196456 -594 194579 5912 40 3964 20180131 2017 DDS 3673.169 221.324 6422.676 5311 41 27936 20180131 2017 DEST 162.582 -21.597 405.443 5621 42 4016 20180131 2017 DG 12516.911 1538.96 23470.967 5331 43 150139 20180131 2017 DKS 4203.939 323.445 8590.472 5940 44 26335 20180131 2017 DLTH 223.102 23.351 471.447 5961 45 31587 20180131 2017 DLTR 16332.8 1714.3 22245.5 5331 Sheet1 Ready
Step by Step Solution
There are 3 Steps involved in it
Step: 1
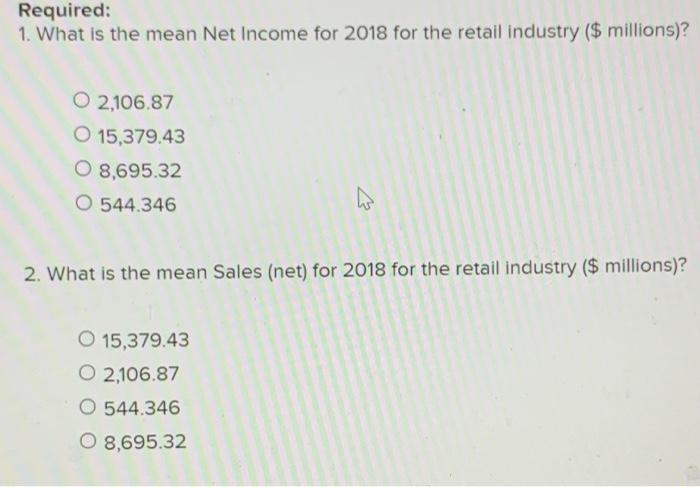
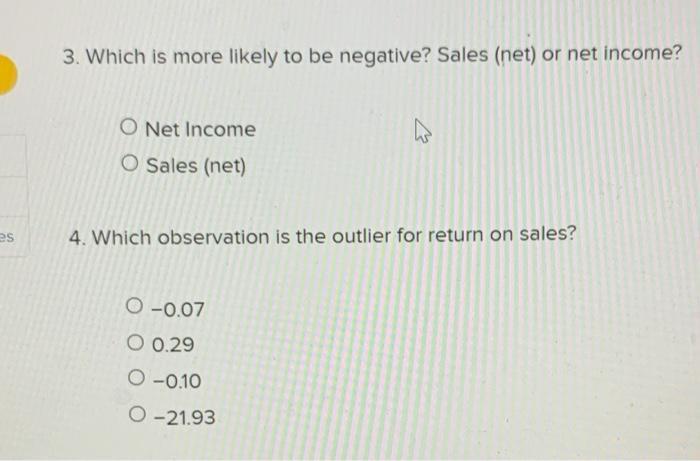
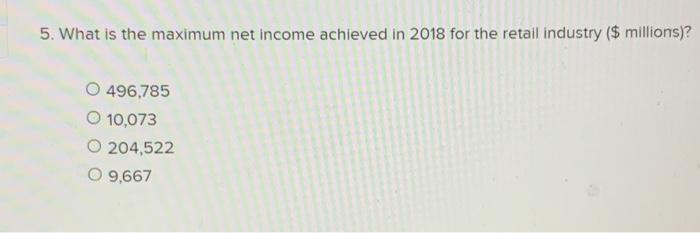
Here are the answers to the questions based on the table 1 What is the mean Net Income for 2018 for ...
See step-by-step solutions with expert insights and AI powered tools for academic success
Step: 2

Step: 3
Ace Your Homework with AI
Get the answers you need in no time with our AI-driven, step-by-step assistance
Get Started
Authors: Eugene F. Brigham, Michael C. Ehrhardt
16th edition
1337902608, 978-1337902601