Answered step by step
Verified Expert Solution
Link Copied!

Question

1 Approved Answer

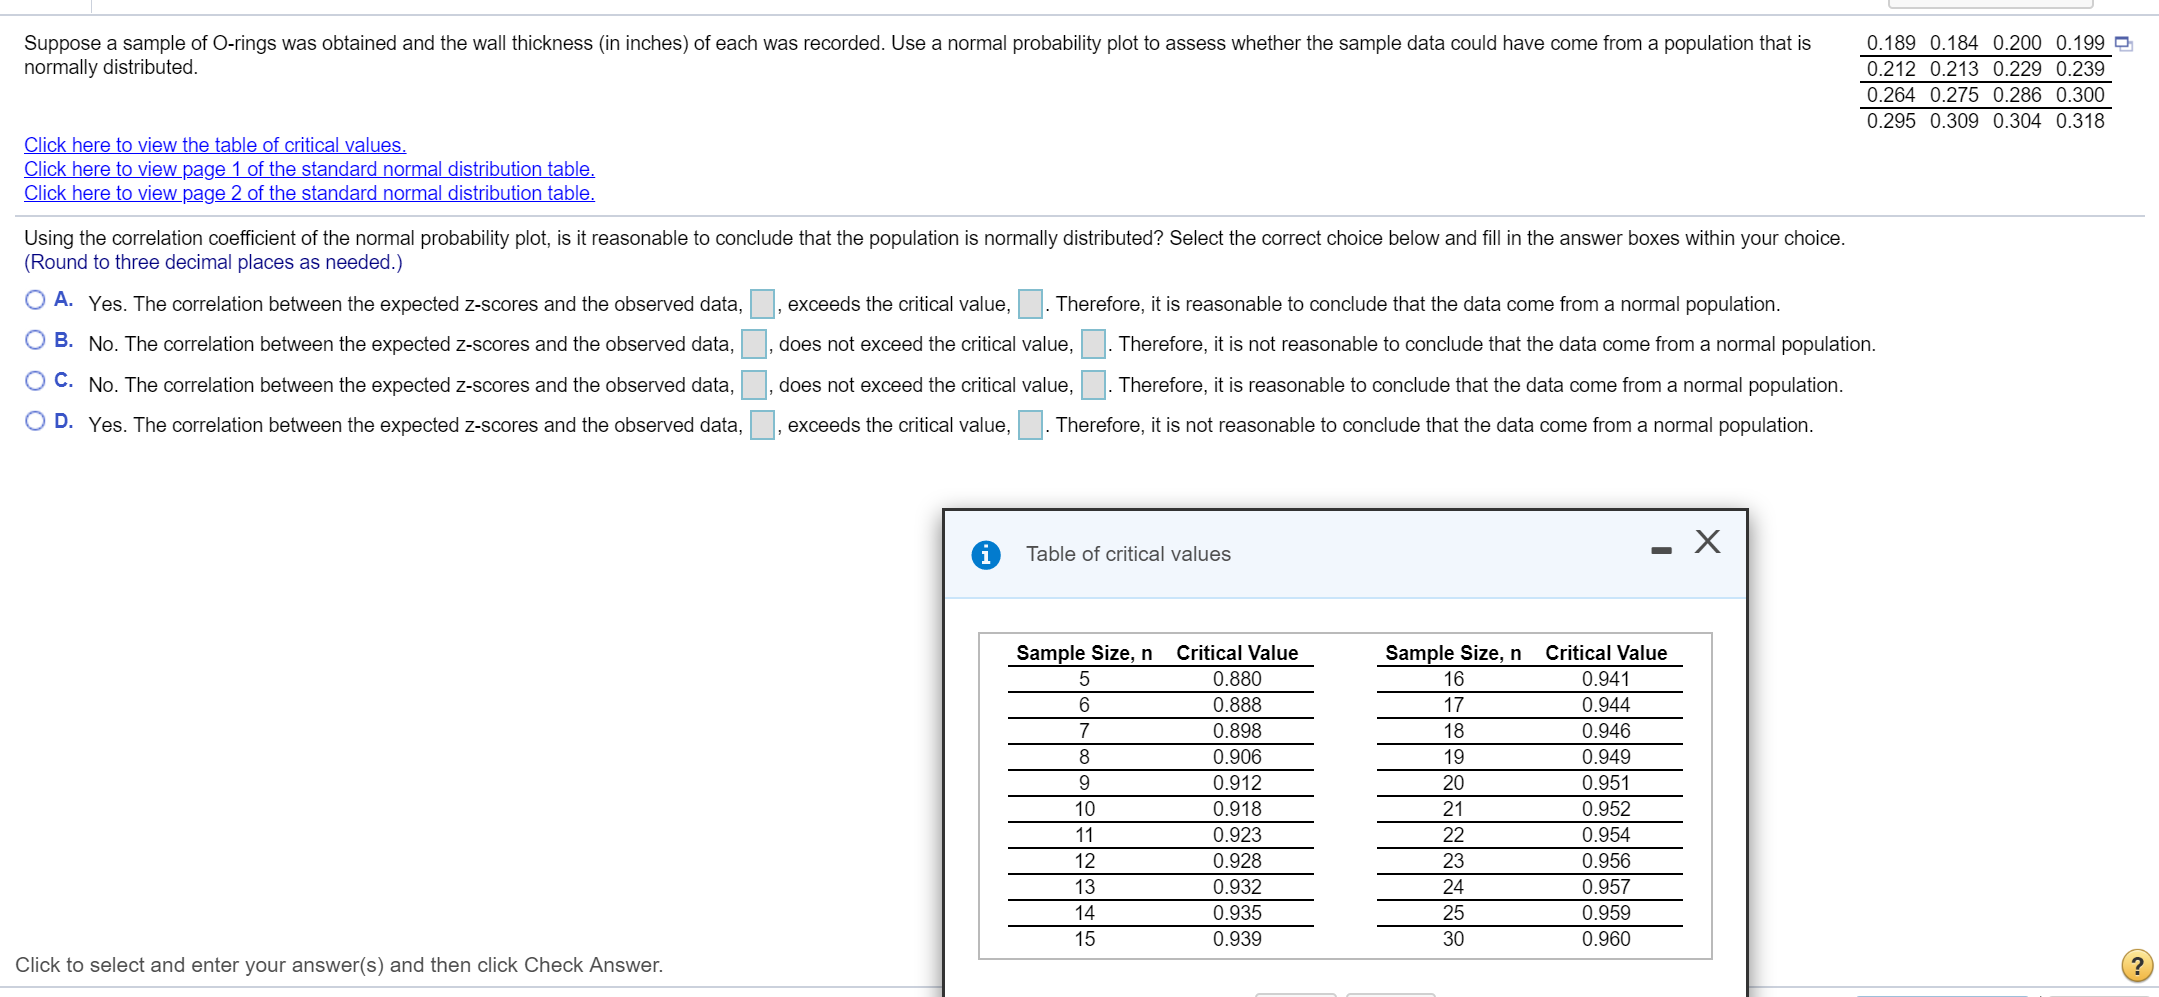
Help with the following and how to solve it pls and thank you Suppose a sample of O-rings was obtained and the wall thickness (in

Help with the following and how to solve it pls and thank you

image text in transcribed
Suppose a sample of O-rings was obtained and the wall thickness (in inches) of each was recorded. Use a normal probability plot to assess whether the sample data could have come from a population that is normally distributed. Click here to view the table of critical values. Click here to view page 1 of the standard normal distribution table. Click here to view page 2 of the standard normal distribution table. Using the correlation coefcient of the normal probability plot, is it reasonable to conclude that the population is normally distributed? Select the correct choice below and ll in the answer boxes within your choice. (Round to three decimal places as needed.) 0 A- Yes. The correlation between the expected zscores and the observed data, I: exceeds the critical value, O 3- No. The correlation between the expected zscores and the observed data, , does not exceed the critical O C- No. The correlation between the expected zscores and the observed data, , does not exceed the critical O D- Yes. The correlation between the expected zscores and the observed data, I: , exceeds the critical value, value, value, 0 Table of critical values . Therefore, it is reasonable to conclude that the data come from a normal population. :I. Therefore, it is reasonable to conclude that the data come from a normal population. . Therefore, it is not reasonable to conclude that the data come from a normal population. -X Sample Size, n Critical Value Sample Size, n Critical Value 5 0.880 16 0.941 6 0.888 17 0.944 7 0.898 18 0.946 8 0.906 19 0.949 9 0.912 20 0.951 10 0.918 21 0.952 11 12 13 14 15 0.923 0.928 0.932 0.935 0.939 22 23 24 25 30 0.954 0.956 0.957 0.959 0.960 Click to select and enter your answer(s) and then click Check Answer. 0.189 0.184 0.200 0.199 Q 0.212 0213 0.229 0.239 0.264 0.275 0.286 0.300 0.295 0.309 0.304 0.318 :I. Therefore, it is not reasonable to conclude that the data come from a normal population

Step by Step Solution

There are 3 Steps involved in it

Step: 1

blur-text-image

Get Instant Access to Expert-Tailored Solutions

See step-by-step solutions with expert insights and AI powered tools for academic success

Step: 2

blur-text-image

Step: 3

blur-text-image

Ace Your Homework with AI

Get the answers you need in no time with our AI-driven, step-by-step assistance

Get Started

Recommended Textbook for

Complex Variables and Applications

Authors: James Brown, Ruel Churchill

8th edition

73051942, 978-0073051949

More Books

Students also viewed these Mathematics questions

Question

Why do you need to write this document?

Answered: 1 week ago

Question

Write a note on Historical Development of clinical Trials?

Answered: 1 week ago