

Answered step by step
Verified Expert Solution
Question
1 Approved Answer
Here are simplified financial statements for Phone Corporation in a recent year: INCOME STATEMENT (Figures in $ millions) Net sales Cost of goods sold Other
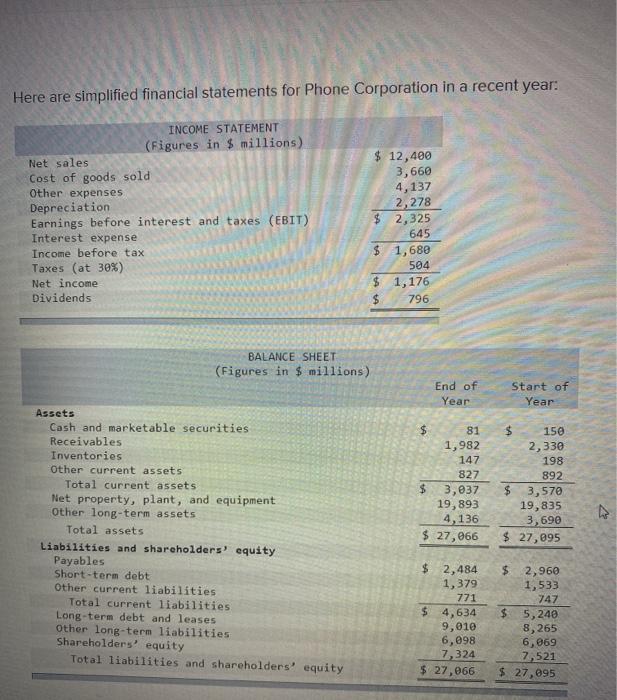
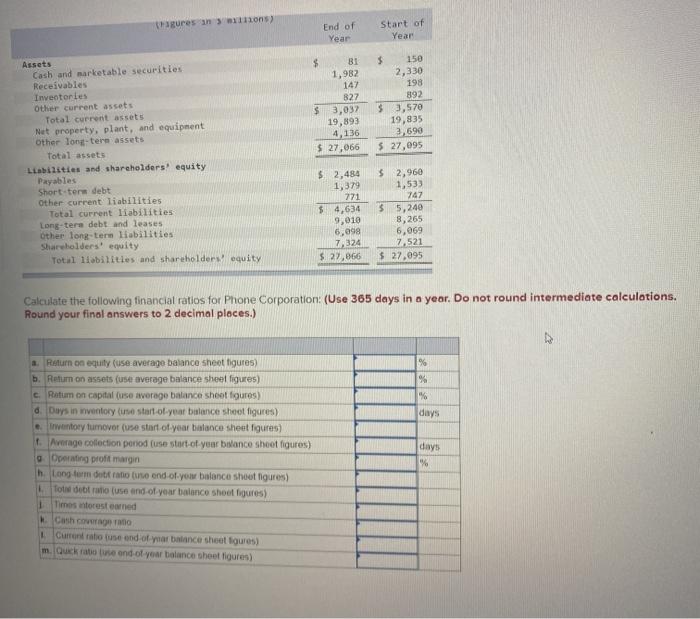 Here are simplified financial statements for Phone Corporation in a recent year: INCOME STATEMENT (Figures in $ millions) Net sales Cost of goods sold Other expenses Depreciation Earnings before interest and taxes (EBIT) Interest expense Income before tax Taxes (at 30%) Net income Dividends 12,400 3,660 4,137 2,278 $ 2,325 645 $ 1,680 504 $ 1,176 $ 796 BALANCE SHEET (Figures in $ millions) End of Start of Year Year $ 81 Assets Cash and marketable securities Receivables Inventories Other current assets Total current assets Net property, plant, and equipment Other long-term assets Total assets Liabilities and shareholders' equity Payables Short-term debt Other current liabilities Total current liabilities Long-term debt and leases Other long-term liabilities Shareholders' equity Total liabilities and shareholders' equity 1,982 147 827 $ 3,037 19,893 4,136 $ 27,066 $ 150 2,330 198 892 $ 3,570 19,835 3,690 $ 27,095 $ 2,484 1,379 771 $ 4,634 9,010 6,098 7,324 $ 27,066 $ 2,960 1,533 747 $ 5,240 8, 265 6,069 7,521 $ 27,095 gures in ons End of Year Start of Year $ BI 1,982 147 827 $ 3,032 19,893 4,136 $ 27,066 5 150 2,330 198 892 $ 3,570 19,835 3,690 $ 27,095 Assets Cash and marketable securities Receivables Investories Other current assets Total current assets Net property, plant, and equipment Other long-term assets Total assets Liabilities and shareholders' equity Payables Short-term debt Other current liabilities Total current liabilities Long-term debt and leases Other long-term liabilities Shareholders' equity Total liabilities and shareholders equity $ 2,484 1,379 771 $ 4,634 9,010 6,098 7,324 $27,066 $ 2,960 1,533 747 $ 5,249 8,265 6,069 17.521 $ 27,095 Calculate the following financial ratios for Phone Corporation: (Use 365 days in a year. Do not round intermediate calculations. Round your final answers to 2 decimal places.) % % days a. Return on equity (use average balance sheet figures) b. Return on assets (use average balance sheet figures) c. Return on capital use tiverage balance sheet figures) 0 Days in inventory (use start of year balance sheet figures) Inventory turnover (use start of year balance sheet figures) 1. Average collection period (use start of year balance sheet figures) g Operating profit margin h Long term dat ratio use end of yow balance sheet figures) To dobro use end of year balance sheet figures) Times interest earned # Cash coverage Currentouse end of a balance sheet igures) m. Quick ratio uend of your balance sheet figures) days %
Step by Step Solution
There are 3 Steps involved in it
Step: 1

Get Instant Access to Expert-Tailored Solutions
See step-by-step solutions with expert insights and AI powered tools for academic success
Step: 2

Step: 3
Ace Your Homework with AI
Get the answers you need in no time with our AI-driven, step-by-step assistance
Get Started
Accounting
Authors: Carl s. warren, James m. reeve, Philip e. fess
21st Edition
978-0324400205, 324225016, 324188005, 324400209, 9780324225013, 978-0324188004