

Answered step by step
Verified Expert Solution
Question
1 Approved Answer
Here is a chart of the index value for the S&P 500 and the United Kingdom's main equity index, the FTSE 100, from the end
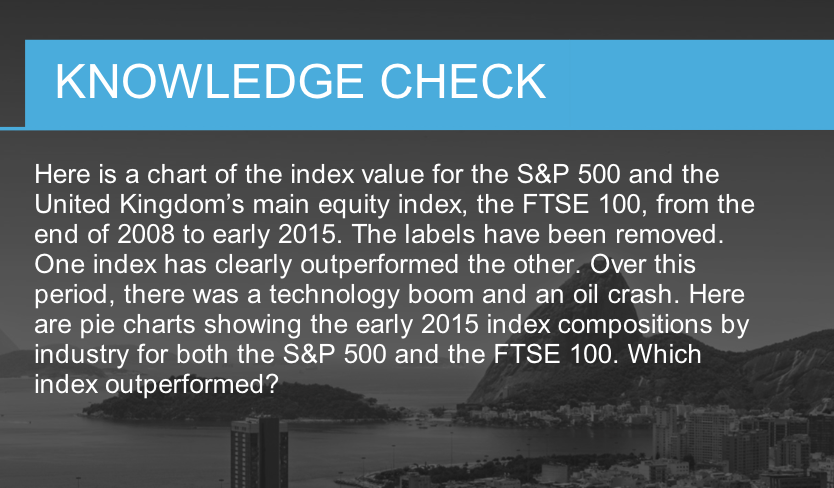 Here is a chart of the index value for the S\&P 500 and the United Kingdom's main equity index, the FTSE 100, from the end of 2008 to early 2015 . The labels have been removed. One index has clearly outperformed the other. Over this period, there was a technology boom and an oil crash. Here are pie charts showing the early 2015 index compositions by industry for both the S\&P 500 and the FTSE 100. Which index outperformed
 Step by Step Solution
There are 3 Steps involved in it
Step: 1

Get Instant Access to Expert-Tailored Solutions
See step-by-step solutions with expert insights and AI powered tools for academic success
Step: 2

Step: 3
Ace Your Homework with AI
Get the answers you need in no time with our AI-driven, step-by-step assistance
Get Started
Financial statements
Authors: Stephen Barrad
5th Edition
978-007802531, 9780324186383, 032418638X