Question: heres my work can i have some help with the discussion questions please this is background and procedures Solutions 0.1MNaOH concentration 0.01MNaOH concentration 0.1013M Mass
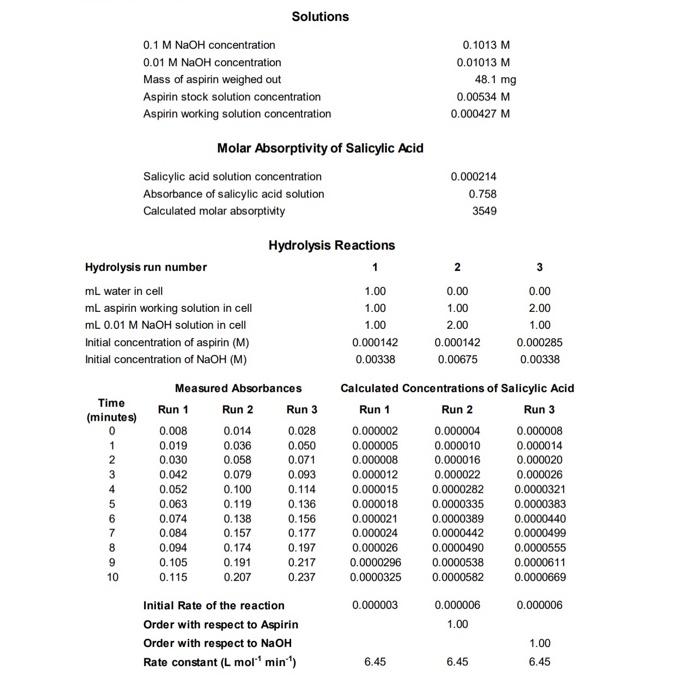
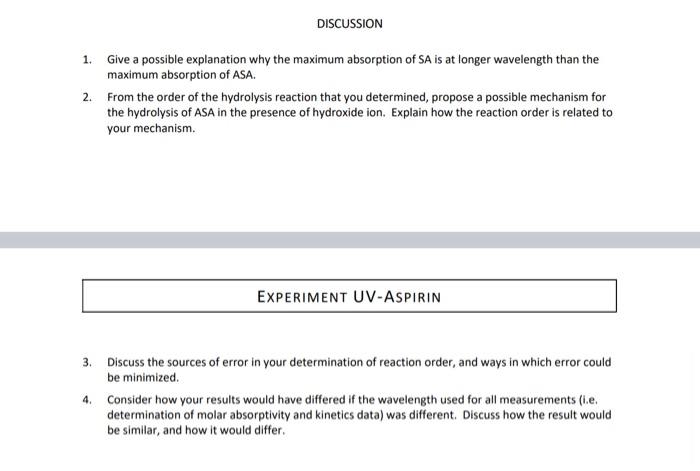
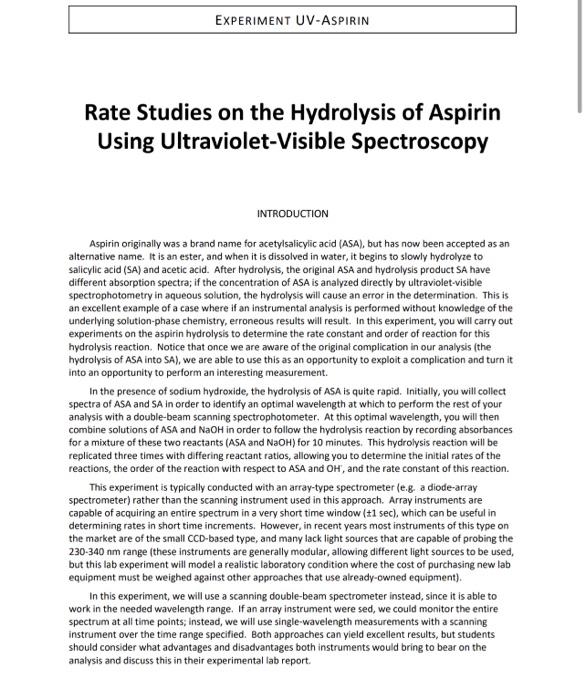
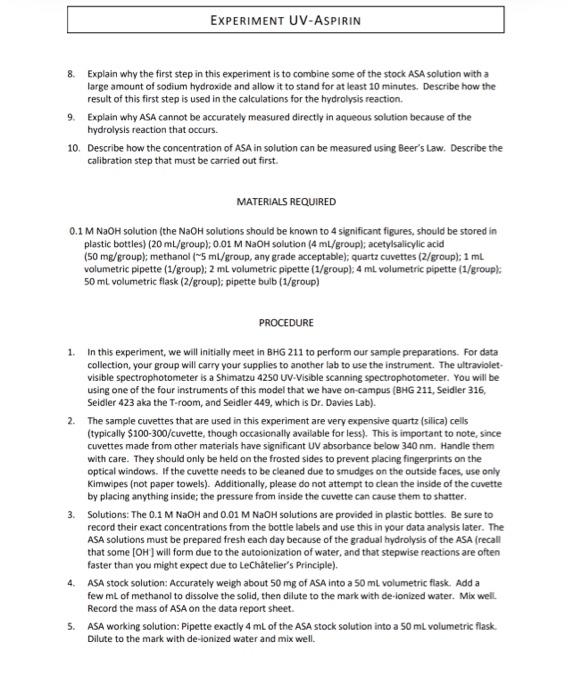
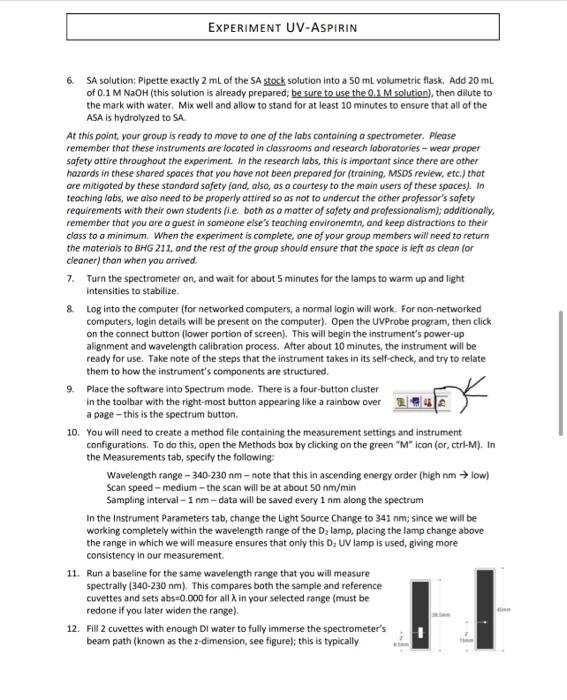
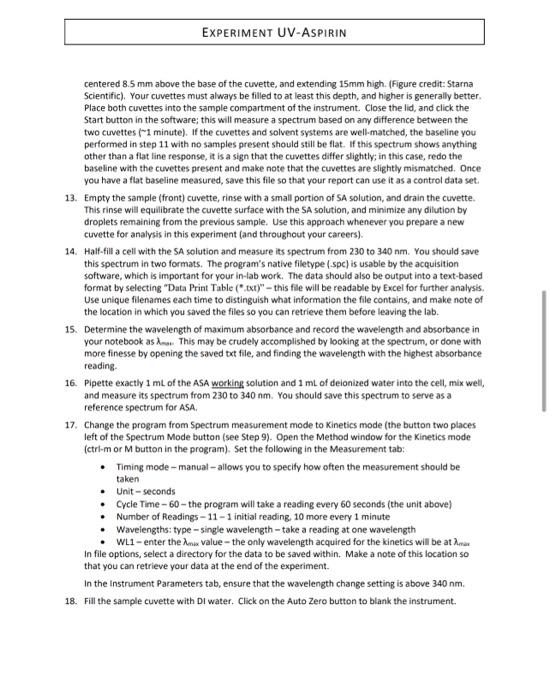
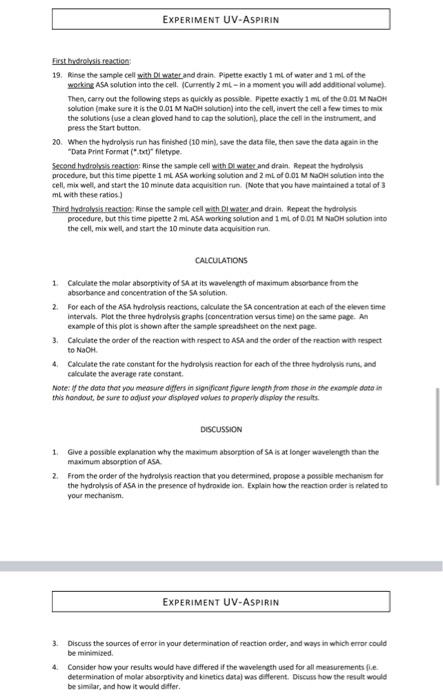
Solutions 0.1MNaOH concentration 0.01MNaOH concentration 0.1013M Mass of aspirin weighed out 0.01013M Aspirin stock solution concentration Aspirin working solution concentration 48.1mg Molar Absorptivity of Salicylic Acid Salicylic acid solution concentration Absorbance of salicylic acid solution 0.00534M 0.000427M Calculated molar absorptivity 0.000214 0.758 3549 Hydrolysis Reactions Hydrolysis run number mLwaterincellmLaspirinworkingsolutionincellmL0.01MNaOHsolutionincellInitialconcentrationofaspirin(M)InitialconcentrationofNaOH(M)1.001.001.000.0001420.003380.001.002.000.0001420.006750.002.001.000.0002850.00338 Measured Absorbances Calculated Concentrations of Salicylic Acid 1. Give a possible explanation why the maximum absorption of SA is at longer wavelength than the maximum absorption of ASA. 2. From the order of the hydrolysis reaction that you determined, propose a possible mechanism for the hydrolysis of ASA in the presence of hydroxide ion. Explain how the reaction order is related to your mechanism. EXPERIMENT UV-ASPIRIN 3. Discuss the sources of error in your determination of reaction order, and ways in which error could be minimized. 4. Consider how your results would have differed if the wavelength used for all measurements (i.e. determination of molar absorptivity and kinetics data) was different. Discuss how the result would be similar, and how it would differ. Rate Studies on the Hydrolysis of Aspirin Using Ultraviolet-Visible Spectroscopy INTRODUCTION Aspirin originally was a brand name for acetylsalicylic acid (ASA), but has now been accepted as an alternative name. It is an ester, and when it is dissolved in water, it begins to slowly hydrolyze to salicylic acid (SA) and acetic acid. After hydrolysis, the original ASA and hydrolysis product SA have different absorption spectra; if the concentration of ASA is analyzed directly by ultraviolet-visible spectrophotometry in aqueous solution, the hydrolysis will cause an error in the determination. This is an excellent example of a case where if an instrumental analysis is performed without knowledge of the underlying solution-phase chemistry, erroneous results will result. In this experiment, you will carry out experiments on the aspirin hydrolysis to determine the rate constant and order of reaction for this hydrolysis reaction. Notice that once we are aware of the original complication in our analysis (the hydrolysis of ASA into SA), we are able to use this as an opportunity to exploit a complication and turn it into an opportunity to perform an interesting measurement. In the presence of sodium hydroxide, the hydrolysis of ASA is quite rapid. Initially, you will collect spectra of ASA and SA in order to identify an optimal wavelength at which to perform the rest of your analysis with a double-beam scanning spectrophotometer. At this optimal wavelength, you will then combine solutions of ASA and NaOH in order to follow the hydrolysis reaction by recording absorbances for a mixture of these two reactants ( ASA and NaOH ) for 10 minutes. This hydrolysis reaction will be replicated three times with differing reactant ratios, allowing you to determine the initial rates of the reactions, the order of the reaction with respect to ASA and OH, and the rate constant of this reaction. This experiment is typically conducted with an array-type spectrometer (e.g. a diode-array spectrometer) rather than the scanning instrument used in this approach. Array instruments are capable of acquiring an entire spectrum in a very short time window ( 1 sec), which can be useful in determining rates in short time increments. However, in recent years most instruments of this type on the market are of the small CCD-based type, and many lack light sources that are capable of probing the 230-340 nm range (these instruments are generally modular, allowing different light sources to be used, but this lab experiment will model a realistic laboratory condition where the cost of purchasing new lab equipment must be weighed against other approaches that use already-owned equipment). In this experiment, we will use a scanning double-beam spectrometer instead, since it is able to work in the needed wavelength range. If an array instrument were sed, we could monitor the entire spectrum at all time points; instead, we will use single-wavelength measurements with a scanning instrument over the time range specified. Both approaches can yield excellent results, but students should consider what advantages and disadvantages both instruments would bring to bear on the analysis and discuss this in their experimental lab report. EXPERIMENT UV-ASPIRIN 8. Explain why the first step in this experiment is to combine some of the stock ASA solution with a large amount of sodium hydroxide and allow it to stand for at least 10 minutes. Describe how the result of this first step is used in the calculations for the hydrolysis reaction. 9. Explain why ASA cannot be accurately measured directly in aqueous solution because of the hydrolysis reaction that occurs. 10. Describe how the concentration of ASA in solution can be measured using Beer's Law. Describe the calibration step that must be carried out first. MATERIALS REQUIRED 0.1MNaOH solution (the NaOH solutions should be known to 4 significant figures, should be stored in plastic bottles) (20 mL/group); 0.01MNaOH solution (4 mL/group); acetylsalicylic acid ( 50mg/ group); methanol ( 5mL group, any grade acceptable); quartz cuvettes (2/group); 1mL. volumetric pipette ( 1/group);2mL volumetric pipette (1/group); 4mL volumetric pipette ( 1/group) : 50mL volumetric flask (2/group); pipette bulb (1/group) PROCEDURE 1. In this experiment, we will initially meet in BHG 211 to perform our sample preparations. For data collection, your group will carry your supplies to another lab to use the instrument. The ultravioletvisible spectrophotometer is a Shimatzu 4250 UV-Visible scanning spectrophotometer. You will be using one of the four instruments of this model that we have on-campus (BHG 211, Seidler 316, Seidler 423 aka the T-room, and Seidler 449, which is Dr. Davies Lab). 2. The sample cuvettes that are used in this experiment are very expensive quartz (silica) cells (typically $100300/cuvette, though occasionally available for less). This is important to note, since cuvettes made from other materials have significant UV absorbance below 340 nm. Handle them with care. They should only be held on the frosted sides to prevent placing fingerprints on the optical windows. If the cuvette needs to be cleaned due to smudges on the outside faces, use only Kimwipes (not paper towels). Additionally, please do not attempt to clean the inside of the cuvette by placing anything inside; the pressure from inside the cuvette can cause them to shatter. 3. Solutions: The 0.1MNaOH and 0.01MNaOH solutions are provided in plastic bottles. Be sure to record their exact concentrations from the bottle labels and use this in your data analysis later. The ASA solutions must be prepared fresh each day because of the gradual hydrolysis of the ASA (recall that some [OH] will form due to the autoionization of water, and that stepwise reactions are often faster than you might expect due to Lechtelier's Principle). 4. ASA stock solution: Accurately weigh about 50mg of ASA into a 50mL volumetric flask. Add a few mL of methanol to dissolve the solid, then dilute to the mark with de-ionized water. Mix well. Record the mass of ASA on the data report sheet. 5. ASA working solution: Pipette exactly 4mL of the ASA stock solution into a 50mL volumetric flask. Dilute to the mark with de-lonized water and mix well. 6. SA solution: Pipette exactly 2mL of the 5A stock solution into a 50mL volumetric flask. Add 20mL of 0.1MNaOH (this solution is already prepared; be sure to use the 0.1M solution), then dilute to the mark with water. Mix well and allow to stand for at least 10 minutes to ensure that all of the ASA is hydrolyzed to SA. At this point, your group is ready to move to one of the labs contoining a spectrometer. Please remember that these instruments are located in ciassrooms and research foboratories - wear proper safety attire throughout the experiment. In the research labs, this is important since there are other hazards in these shared spoces that you have not been prepared for (training. MSDS review, etc.) that ore mitigoted by these standard safety (and, also, as a courtesy to the main users of these spoces). In teaching labs, we also need to be properly ottired so as not to undercut the other professor's safety requirements with their own students (i.e. both as a matter of safety and professionolism); additionally, remember thot you are a guest in someone else's teaching ervironemtn, and keep distractions to their class to a minimum. When the experiment is complete, one of your group members will need to return the materiols to BHG 211, and the rest of the group should ensure that the spoce is left as clean (or cleaner) than when you arrived. 7. Turn the spectrometer on, and wait for about 5 minutes for the lamps to warm up and light intensities to stabilize. 8. Log into the computer (for networked computers, a normal login will work. For non-networked computers, login details will be present on the computer). Open the UVProbe program, then click on the connect button (lower portion of screen). This will begin the instrument's power-up alignment and wavelength calibration process. After about 10 minutes, the instrument will be ready for use. Take note of the steps that the instrument takes in its self-check, and try to relate them to how the instrument's components are structured. 9. Place the software into Spectrum mode. There is a four-button cluster in the toolbar with the right-most button appearing like a rainbow over a page - this is the spectrum button. 10. You will need to create a method file containing the measurement settings and instrument configurations. To do this, open the Methods box by clicking on the green " M icon (or, ctrl-M). In the Measurements tab, specify the following: Wavelength range - 340230nm - note that this in ascending energy order (high nm low) Scan speed - medium - the scan will be at about 50nm/min Sampling interval - 1nm - data will be saved every 1 nm along the spectrum In the Instrument Parameters tab, change the Light Source Change to 341 nm; since we will be working completely within the wavelength range of the D2 lamp, placing the lamp change above the range in which we will measure ensures that only this D2 UV lamp is used, giving more consistency in our measurement. 11. Run a baseline for the same wavelength range that you will measure spectrally (340-230 nm). This compares both the sample and reference cuvettes and sets abs =0.000 for all in your selected range (must be redone if you later widen the range). 12. Fill 2 cuvettes with enough DI water to fully immerse the spectrometer's beam path (known as the z-dimension, see figure); this is typically centered 8.5mm above the base of the cuvette, and extending 15mm high. (Figure credit: Starna Scientific). Your cuvettes must always be filled to at least this depth, and higher is generally better. Place both cuvettes into the sample compartment of the instrument. Close the lid, and click the Start button in the software; this will measure a spectrum based on any difference between the two cuvettes ( 1 minute). If the cuvettes and solvent systems are well-matched, the baseline you performed in step 11 with no samples present should still be flat. If this spectrum shows anything other than a flat line response, it is a sign that the cuvettes differ slightly; in this case, redo the baseline with the cuvettes present and make note that the cuvettes are slightly mismatched. Once you have a flat baseline measured, save this file so that your report can use it as a control data set. 13. Empty the sample (front) cuvette, rinse with a small portion of SA solution, and drain the cuvette. This rinse will equilibrate the cuvette surface with the SA solution, and minimize any dilution by droplets remaining from the previous sample. Use this approach whenever you prepare a new cuvette for analysis in this experiment (and throughout your careers). 14. Half-fill a cell with the SA solution and measure its spectrum from 230 to 340nm. You should save this spectrum in two formats. The program's native filetype (.spc) is usable by the acquisition software, which is important for your in-fab work. The data should also be output into a text-based format by selecting "Data Print Table (".txt)" - this file will be readable by Excel for further analysis. Use unique filenames each time to distinguish what information the file contains, and make note of the location in which you saved the files so you can retrieve them before leaving the lab. 15. Determine the wavelength of maximum absorbance and record the wavelength and absorbance in your notebook as as. This may be crudely accomplished by looking at the spectrum, or done with more finesse by opening the saved txt file, and finding the wavelength with the highest absorbance reading. 16. Pipette exactly 1mL of the ASA working solution and 1mL of deionized water into the cell, mix well, and measure its spectrum from 230 to 340nm. You should save this spectrum to serve as a reference spectrum for ASA. 17. Change the program from Spectrum measurement mode to Kinetics mode (the button two places left of the Spectrum Mode button (see Step 9). Open the Method window for the Kinetics mode (ctri-m or M button in the program). Set the following in the Measurement tab: - Timing mode - manual - allows you to specify how often the measurement should be taken - Unit-seconds - Cycle Time - 60 - the program will take a reading every 60 seconds (the unit above) - Number of Readings 11 - 1 initial reading, 10 more every 1 minute - Wavelengths: type - single wavelength - take a reading at one wavelength - WL1 - enter the max value - the only wavelength acquired for the kinetics will be at mar In file options, select a directory for the data to be saved within. Make a note of this location so that you can retrieve your data at the end of the experiment. In the Instrument Parameters tab, ensure that the wavelength change setting is above 340nm. 18. Fill the sample cuvette with DI water. Click on the Auto Zero button to blank the instrument. First hndroksis feaction: 19. Winse the sample cell with Di watet and drain. Pipette exactly 1mt of water and 1ml of the works, ASA solution into the cell. (Currently 2mL - in a moment you will add addaional velume). Then, carry out the following steps as quickly as possole. Pipette exactly a mit of the 0.01MNOH solution (make sure it is the 0.01MNaOH solution) into the cell, invert the cell a few times to mix. the solutions (use a clean gloved hand to cap the solutionl. place the cell in the instrument, and press the Start button. 20. When the hydrolysis run has finished (10 minl, swe the data file, then save the data again in the "Data Print Format (".tote" filetype. Secend hydrohris feaction: Rinse the sample cell with De wates and drain. Mepeat the hydrolysis procedure, but this time pipette 1mL. ASA working solution and 2mL of 0.01MNaOH solution into the cell, mix well, and start the 10 minute data acquilition run. (Note that you have maintained a total of 3 mL with these ratios] Thind hydrolveis reaction: Rinse the sample cell with Dl water and drain. Repent the hydrolysis procedure, but this time pipette 2mL. ASA working solution and 1mL of 0.01MNaOH yolution into the cell, mix well, and start the 10 minute data acquisition run. CALCULATIONS 1. Calculate the molas absorptivity of SA at its waveleneth of maximum absorbance from the absorbance and concentration of the 5A solution. 2. For each of the ASA mydrolysis reactions, calculate the SA concentration at each of the eleven sime intervals. Plot the three hydrolysis graphs fconcentration versus time\} on the same page. An example of this plot is shown after the sample spreadsheet on the neat page. 3. Calculate the order of the reaction with respect to ASA and the order of the reaction with respect to NaOH. 4. Catculate the rate constant for the hydrolyys reaction for each of the three hydrolysio ruas, and cakcubte the average rate coestant. Note: of the dota thot you meosure differs in significont figure iength from these in the example dote in this handout, be sure to adjust your disployed volues to properiy disploy the results. DISCUSSION 1. Give a possible explacution why the maximum absorption of SA is at longer wavelengh than the maximum abvorption of ASA. 2. From the order of the mydrolysis reaction that you determined, propose a possible mechanvm for the hydrolysis of ASA in the presence of bydroxide ion. Explain how the reaction order is reiated to your mechanism. EXPERIMENT UV-ASPIRIN 3. Oiscuss the sources of error in your determination of reaction order, and ways in which error could be minimited. 4. Consider how your results would have differed if the wavelength used for all measurements fi.e. determination of molar absorptivity and kinetics data) was dilferent. Discuss how the result would be similar, and how it would differ. Solutions 0.1MNaOH concentration 0.01MNaOH concentration 0.1013M Mass of aspirin weighed out 0.01013M Aspirin stock solution concentration Aspirin working solution concentration 48.1mg Molar Absorptivity of Salicylic Acid Salicylic acid solution concentration Absorbance of salicylic acid solution 0.00534M 0.000427M Calculated molar absorptivity 0.000214 0.758 3549 Hydrolysis Reactions Hydrolysis run number mLwaterincellmLaspirinworkingsolutionincellmL0.01MNaOHsolutionincellInitialconcentrationofaspirin(M)InitialconcentrationofNaOH(M)1.001.001.000.0001420.003380.001.002.000.0001420.006750.002.001.000.0002850.00338 Measured Absorbances Calculated Concentrations of Salicylic Acid 1. Give a possible explanation why the maximum absorption of SA is at longer wavelength than the maximum absorption of ASA. 2. From the order of the hydrolysis reaction that you determined, propose a possible mechanism for the hydrolysis of ASA in the presence of hydroxide ion. Explain how the reaction order is related to your mechanism. EXPERIMENT UV-ASPIRIN 3. Discuss the sources of error in your determination of reaction order, and ways in which error could be minimized. 4. Consider how your results would have differed if the wavelength used for all measurements (i.e. determination of molar absorptivity and kinetics data) was different. Discuss how the result would be similar, and how it would differ. Rate Studies on the Hydrolysis of Aspirin Using Ultraviolet-Visible Spectroscopy INTRODUCTION Aspirin originally was a brand name for acetylsalicylic acid (ASA), but has now been accepted as an alternative name. It is an ester, and when it is dissolved in water, it begins to slowly hydrolyze to salicylic acid (SA) and acetic acid. After hydrolysis, the original ASA and hydrolysis product SA have different absorption spectra; if the concentration of ASA is analyzed directly by ultraviolet-visible spectrophotometry in aqueous solution, the hydrolysis will cause an error in the determination. This is an excellent example of a case where if an instrumental analysis is performed without knowledge of the underlying solution-phase chemistry, erroneous results will result. In this experiment, you will carry out experiments on the aspirin hydrolysis to determine the rate constant and order of reaction for this hydrolysis reaction. Notice that once we are aware of the original complication in our analysis (the hydrolysis of ASA into SA), we are able to use this as an opportunity to exploit a complication and turn it into an opportunity to perform an interesting measurement. In the presence of sodium hydroxide, the hydrolysis of ASA is quite rapid. Initially, you will collect spectra of ASA and SA in order to identify an optimal wavelength at which to perform the rest of your analysis with a double-beam scanning spectrophotometer. At this optimal wavelength, you will then combine solutions of ASA and NaOH in order to follow the hydrolysis reaction by recording absorbances for a mixture of these two reactants ( ASA and NaOH ) for 10 minutes. This hydrolysis reaction will be replicated three times with differing reactant ratios, allowing you to determine the initial rates of the reactions, the order of the reaction with respect to ASA and OH, and the rate constant of this reaction. This experiment is typically conducted with an array-type spectrometer (e.g. a diode-array spectrometer) rather than the scanning instrument used in this approach. Array instruments are capable of acquiring an entire spectrum in a very short time window ( 1 sec), which can be useful in determining rates in short time increments. However, in recent years most instruments of this type on the market are of the small CCD-based type, and many lack light sources that are capable of probing the 230-340 nm range (these instruments are generally modular, allowing different light sources to be used, but this lab experiment will model a realistic laboratory condition where the cost of purchasing new lab equipment must be weighed against other approaches that use already-owned equipment). In this experiment, we will use a scanning double-beam spectrometer instead, since it is able to work in the needed wavelength range. If an array instrument were sed, we could monitor the entire spectrum at all time points; instead, we will use single-wavelength measurements with a scanning instrument over the time range specified. Both approaches can yield excellent results, but students should consider what advantages and disadvantages both instruments would bring to bear on the analysis and discuss this in their experimental lab report. EXPERIMENT UV-ASPIRIN 8. Explain why the first step in this experiment is to combine some of the stock ASA solution with a large amount of sodium hydroxide and allow it to stand for at least 10 minutes. Describe how the result of this first step is used in the calculations for the hydrolysis reaction. 9. Explain why ASA cannot be accurately measured directly in aqueous solution because of the hydrolysis reaction that occurs. 10. Describe how the concentration of ASA in solution can be measured using Beer's Law. Describe the calibration step that must be carried out first. MATERIALS REQUIRED 0.1MNaOH solution (the NaOH solutions should be known to 4 significant figures, should be stored in plastic bottles) (20 mL/group); 0.01MNaOH solution (4 mL/group); acetylsalicylic acid ( 50mg/ group); methanol ( 5mL group, any grade acceptable); quartz cuvettes (2/group); 1mL. volumetric pipette ( 1/group);2mL volumetric pipette (1/group); 4mL volumetric pipette ( 1/group) : 50mL volumetric flask (2/group); pipette bulb (1/group) PROCEDURE 1. In this experiment, we will initially meet in BHG 211 to perform our sample preparations. For data collection, your group will carry your supplies to another lab to use the instrument. The ultravioletvisible spectrophotometer is a Shimatzu 4250 UV-Visible scanning spectrophotometer. You will be using one of the four instruments of this model that we have on-campus (BHG 211, Seidler 316, Seidler 423 aka the T-room, and Seidler 449, which is Dr. Davies Lab). 2. The sample cuvettes that are used in this experiment are very expensive quartz (silica) cells (typically $100300/cuvette, though occasionally available for less). This is important to note, since cuvettes made from other materials have significant UV absorbance below 340 nm. Handle them with care. They should only be held on the frosted sides to prevent placing fingerprints on the optical windows. If the cuvette needs to be cleaned due to smudges on the outside faces, use only Kimwipes (not paper towels). Additionally, please do not attempt to clean the inside of the cuvette by placing anything inside; the pressure from inside the cuvette can cause them to shatter. 3. Solutions: The 0.1MNaOH and 0.01MNaOH solutions are provided in plastic bottles. Be sure to record their exact concentrations from the bottle labels and use this in your data analysis later. The ASA solutions must be prepared fresh each day because of the gradual hydrolysis of the ASA (recall that some [OH] will form due to the autoionization of water, and that stepwise reactions are often faster than you might expect due to Lechtelier's Principle). 4. ASA stock solution: Accurately weigh about 50mg of ASA into a 50mL volumetric flask. Add a few mL of methanol to dissolve the solid, then dilute to the mark with de-ionized water. Mix well. Record the mass of ASA on the data report sheet. 5. ASA working solution: Pipette exactly 4mL of the ASA stock solution into a 50mL volumetric flask. Dilute to the mark with de-lonized water and mix well. 6. SA solution: Pipette exactly 2mL of the 5A stock solution into a 50mL volumetric flask. Add 20mL of 0.1MNaOH (this solution is already prepared; be sure to use the 0.1M solution), then dilute to the mark with water. Mix well and allow to stand for at least 10 minutes to ensure that all of the ASA is hydrolyzed to SA. At this point, your group is ready to move to one of the labs contoining a spectrometer. Please remember that these instruments are located in ciassrooms and research foboratories - wear proper safety attire throughout the experiment. In the research labs, this is important since there are other hazards in these shared spoces that you have not been prepared for (training. MSDS review, etc.) that ore mitigoted by these standard safety (and, also, as a courtesy to the main users of these spoces). In teaching labs, we also need to be properly ottired so as not to undercut the other professor's safety requirements with their own students (i.e. both as a matter of safety and professionolism); additionally, remember thot you are a guest in someone else's teaching ervironemtn, and keep distractions to their class to a minimum. When the experiment is complete, one of your group members will need to return the materiols to BHG 211, and the rest of the group should ensure that the spoce is left as clean (or cleaner) than when you arrived. 7. Turn the spectrometer on, and wait for about 5 minutes for the lamps to warm up and light intensities to stabilize. 8. Log into the computer (for networked computers, a normal login will work. For non-networked computers, login details will be present on the computer). Open the UVProbe program, then click on the connect button (lower portion of screen). This will begin the instrument's power-up alignment and wavelength calibration process. After about 10 minutes, the instrument will be ready for use. Take note of the steps that the instrument takes in its self-check, and try to relate them to how the instrument's components are structured. 9. Place the software into Spectrum mode. There is a four-button cluster in the toolbar with the right-most button appearing like a rainbow over a page - this is the spectrum button. 10. You will need to create a method file containing the measurement settings and instrument configurations. To do this, open the Methods box by clicking on the green " M icon (or, ctrl-M). In the Measurements tab, specify the following: Wavelength range - 340230nm - note that this in ascending energy order (high nm low) Scan speed - medium - the scan will be at about 50nm/min Sampling interval - 1nm - data will be saved every 1 nm along the spectrum In the Instrument Parameters tab, change the Light Source Change to 341 nm; since we will be working completely within the wavelength range of the D2 lamp, placing the lamp change above the range in which we will measure ensures that only this D2 UV lamp is used, giving more consistency in our measurement. 11. Run a baseline for the same wavelength range that you will measure spectrally (340-230 nm). This compares both the sample and reference cuvettes and sets abs =0.000 for all in your selected range (must be redone if you later widen the range). 12. Fill 2 cuvettes with enough DI water to fully immerse the spectrometer's beam path (known as the z-dimension, see figure); this is typically centered 8.5mm above the base of the cuvette, and extending 15mm high. (Figure credit: Starna Scientific). Your cuvettes must always be filled to at least this depth, and higher is generally better. Place both cuvettes into the sample compartment of the instrument. Close the lid, and click the Start button in the software; this will measure a spectrum based on any difference between the two cuvettes ( 1 minute). If the cuvettes and solvent systems are well-matched, the baseline you performed in step 11 with no samples present should still be flat. If this spectrum shows anything other than a flat line response, it is a sign that the cuvettes differ slightly; in this case, redo the baseline with the cuvettes present and make note that the cuvettes are slightly mismatched. Once you have a flat baseline measured, save this file so that your report can use it as a control data set. 13. Empty the sample (front) cuvette, rinse with a small portion of SA solution, and drain the cuvette. This rinse will equilibrate the cuvette surface with the SA solution, and minimize any dilution by droplets remaining from the previous sample. Use this approach whenever you prepare a new cuvette for analysis in this experiment (and throughout your careers). 14. Half-fill a cell with the SA solution and measure its spectrum from 230 to 340nm. You should save this spectrum in two formats. The program's native filetype (.spc) is usable by the acquisition software, which is important for your in-fab work. The data should also be output into a text-based format by selecting "Data Print Table (".txt)" - this file will be readable by Excel for further analysis. Use unique filenames each time to distinguish what information the file contains, and make note of the location in which you saved the files so you can retrieve them before leaving the lab. 15. Determine the wavelength of maximum absorbance and record the wavelength and absorbance in your notebook as as. This may be crudely accomplished by looking at the spectrum, or done with more finesse by opening the saved txt file, and finding the wavelength with the highest absorbance reading. 16. Pipette exactly 1mL of the ASA working solution and 1mL of deionized water into the cell, mix well, and measure its spectrum from 230 to 340nm. You should save this spectrum to serve as a reference spectrum for ASA. 17. Change the program from Spectrum measurement mode to Kinetics mode (the button two places left of the Spectrum Mode button (see Step 9). Open the Method window for the Kinetics mode (ctri-m or M button in the program). Set the following in the Measurement tab: - Timing mode - manual - allows you to specify how often the measurement should be taken - Unit-seconds - Cycle Time - 60 - the program will take a reading every 60 seconds (the unit above) - Number of Readings 11 - 1 initial reading, 10 more every 1 minute - Wavelengths: type - single wavelength - take a reading at one wavelength - WL1 - enter the max value - the only wavelength acquired for the kinetics will be at mar In file options, select a directory for the data to be saved within. Make a note of this location so that you can retrieve your data at the end of the experiment. In the Instrument Parameters tab, ensure that the wavelength change setting is above 340nm. 18. Fill the sample cuvette with DI water. Click on the Auto Zero button to blank the instrument. First hndroksis feaction: 19. Winse the sample cell with Di watet and drain. Pipette exactly 1mt of water and 1ml of the works, ASA solution into the cell. (Currently 2mL - in a moment you will add addaional velume). Then, carry out the following steps as quickly as possole. Pipette exactly a mit of the 0.01MNOH solution (make sure it is the 0.01MNaOH solution) into the cell, invert the cell a few times to mix. the solutions (use a clean gloved hand to cap the solutionl. place the cell in the instrument, and press the Start button. 20. When the hydrolysis run has finished (10 minl, swe the data file, then save the data again in the "Data Print Format (".tote" filetype. Secend hydrohris feaction: Rinse the sample cell with De wates and drain. Mepeat the hydrolysis procedure, but this time pipette 1mL. ASA working solution and 2mL of 0.01MNaOH solution into the cell, mix well, and start the 10 minute data acquilition run. (Note that you have maintained a total of 3 mL with these ratios] Thind hydrolveis reaction: Rinse the sample cell with Dl water and drain. Repent the hydrolysis procedure, but this time pipette 2mL. ASA working solution and 1mL of 0.01MNaOH yolution into the cell, mix well, and start the 10 minute data acquisition run. CALCULATIONS 1. Calculate the molas absorptivity of SA at its waveleneth of maximum absorbance from the absorbance and concentration of the 5A solution. 2. For each of the ASA mydrolysis reactions, calculate the SA concentration at each of the eleven sime intervals. Plot the three hydrolysis graphs fconcentration versus time\} on the same page. An example of this plot is shown after the sample spreadsheet on the neat page. 3. Calculate the order of the reaction with respect to ASA and the order of the reaction with respect to NaOH. 4. Catculate the rate constant for the hydrolyys reaction for each of the three hydrolysio ruas, and cakcubte the average rate coestant. Note: of the dota thot you meosure differs in significont figure iength from these in the example dote in this handout, be sure to adjust your disployed volues to properiy disploy the results. DISCUSSION 1. Give a possible explacution why the maximum absorption of SA is at longer wavelengh than the maximum abvorption of ASA. 2. From the order of the mydrolysis reaction that you determined, propose a possible mechanvm for the hydrolysis of ASA in the presence of bydroxide ion. Explain how the reaction order is reiated to your mechanism. EXPERIMENT UV-ASPIRIN 3. Oiscuss the sources of error in your determination of reaction order, and ways in which error could be minimited. 4. Consider how your results would have differed if the wavelength used for all measurements fi.e. determination of molar absorptivity and kinetics data) was dilferent. Discuss how the result would be similar, and how it would differ
Step by Step Solution
There are 3 Steps involved in it

Get step-by-step solutions from verified subject matter experts


