

Question
hi could i have help with this question please Choose one table or graph that contains statistical inference results (i.e. reports p-values or confidence intervals).
hi could i have help with this question please
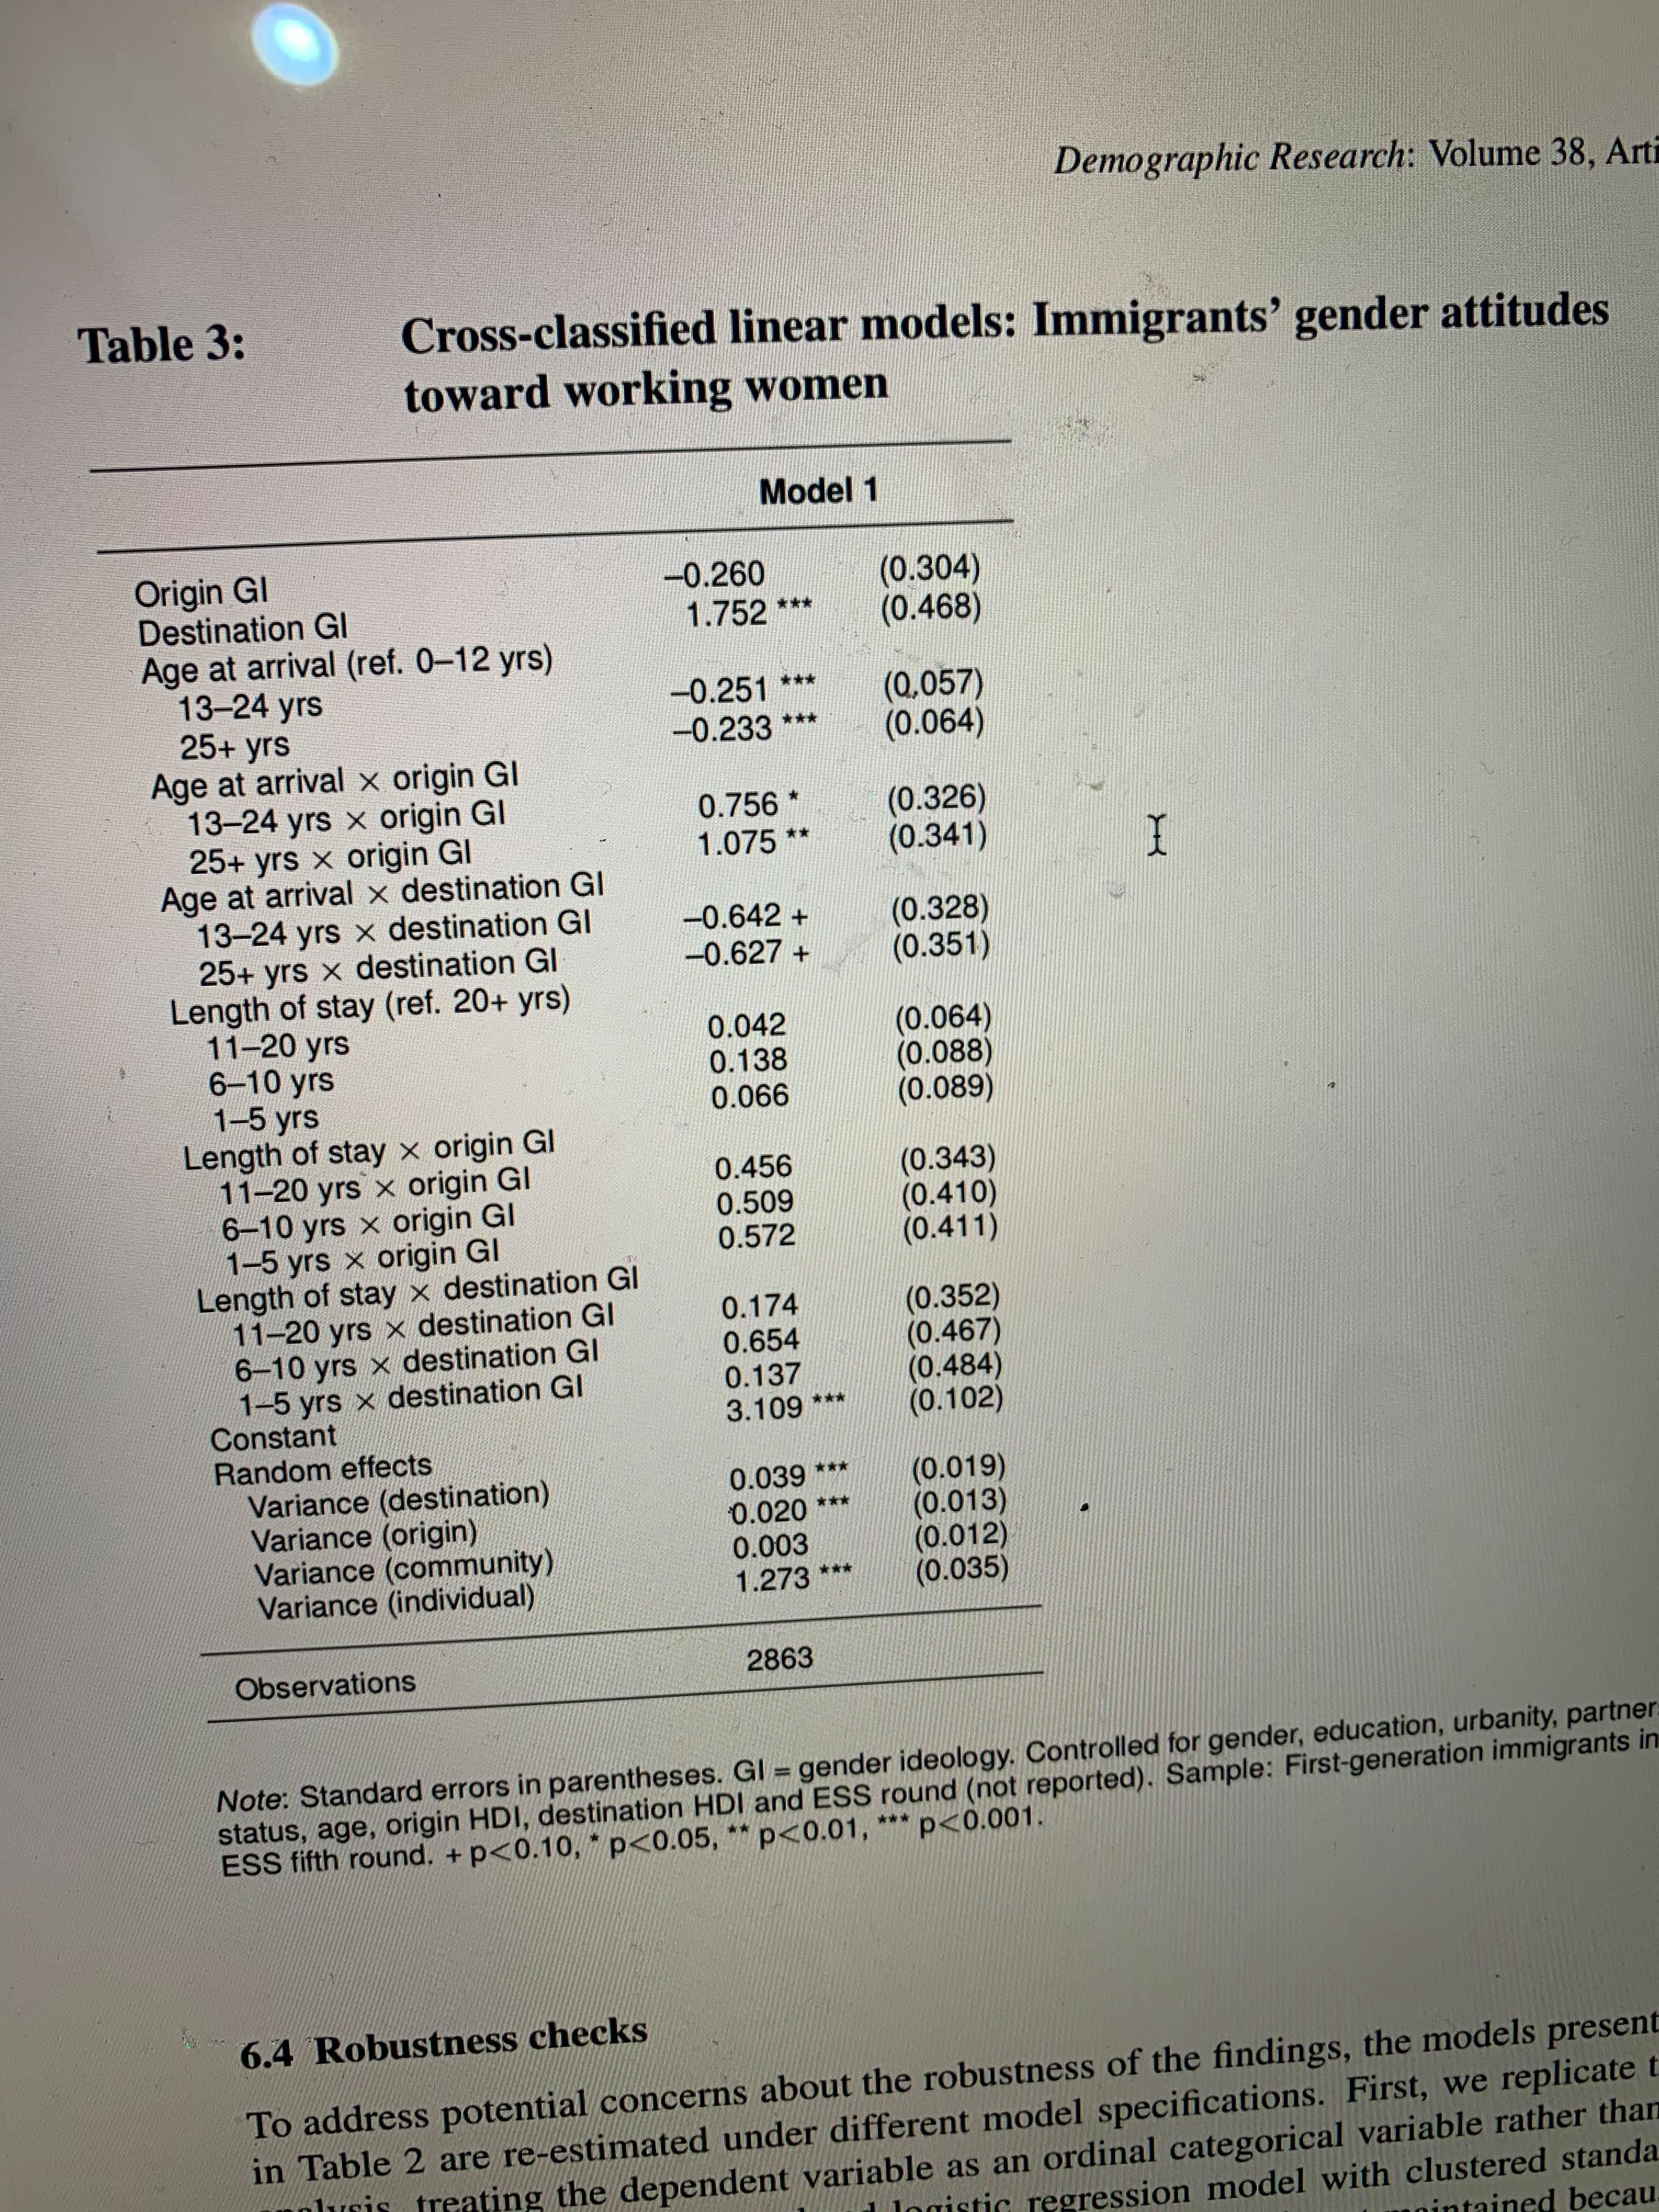
Choose one table or graph that contains statistical inference results (i.e. reports p-values or confidence intervals). Use your own words to explain in detail what conclusions you can draw from the reported p-values or confidence intervals.
NOTE: if the table of interest reports multiple sets of results (for example, for many different regression models), you can focus on the one that shows the final results (this is normally the last column in the table). When explaining the result, please do not forget mentioning which column (set of results) you're focusing on.
Step by Step Solution
There are 3 Steps involved in it
Step: 1

Get Instant Access to Expert-Tailored Solutions
See step-by-step solutions with expert insights and AI powered tools for academic success
Step: 2

Step: 3
Ace Your Homework with AI
Get the answers you need in no time with our AI-driven, step-by-step assistance
Get Started
Applied Calculus
Authors: Stefan Waner, Steven Costenoble
6th Edition
1285415310, 9781285415314