Hi! I hope the attachments work, sorry it's a lot to read through, any help would be appreciated on the questions. Thank you so much!
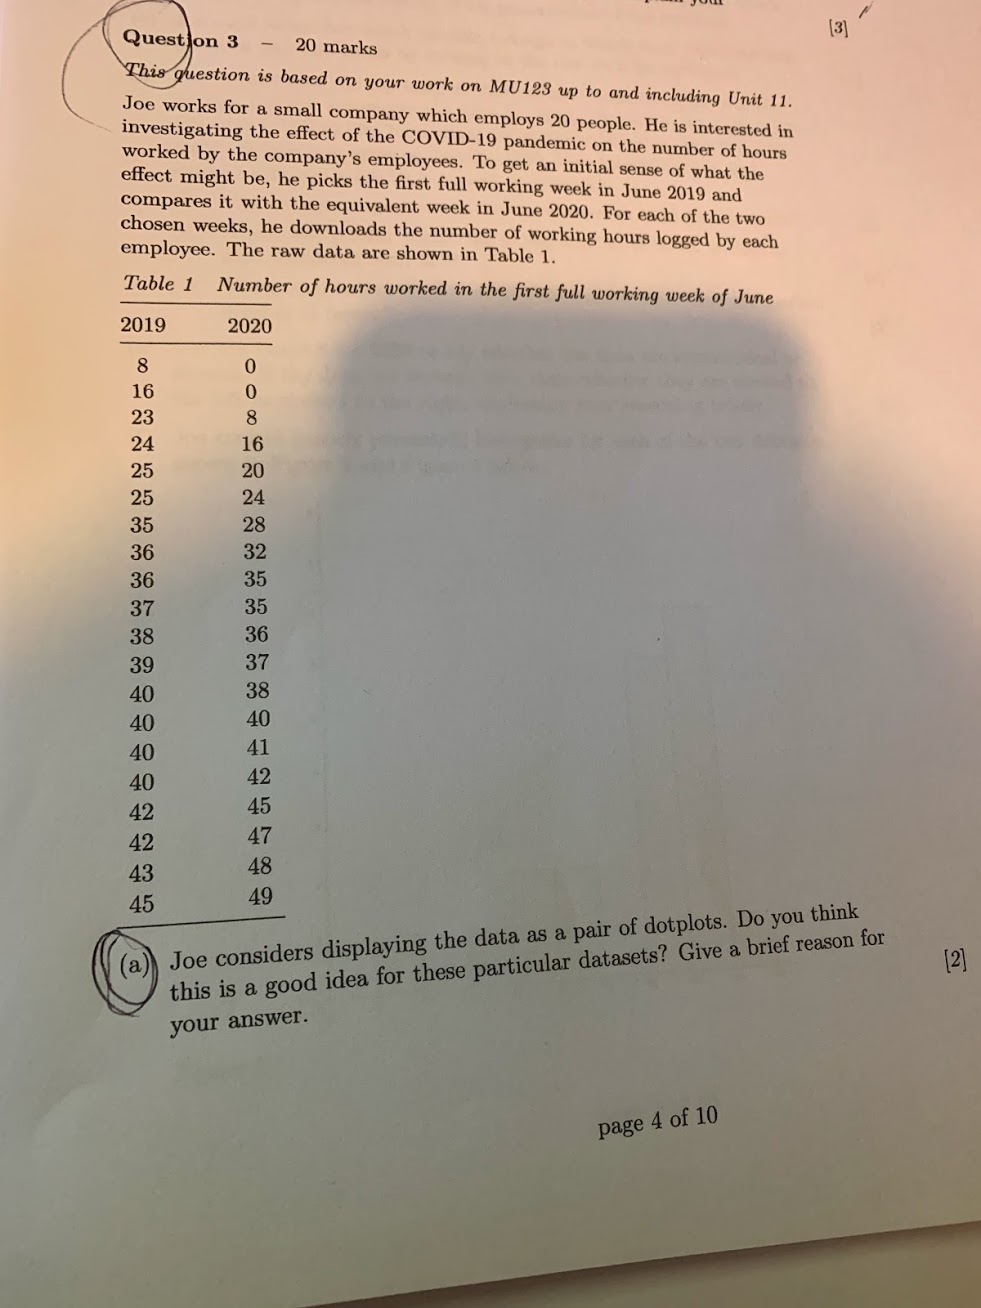
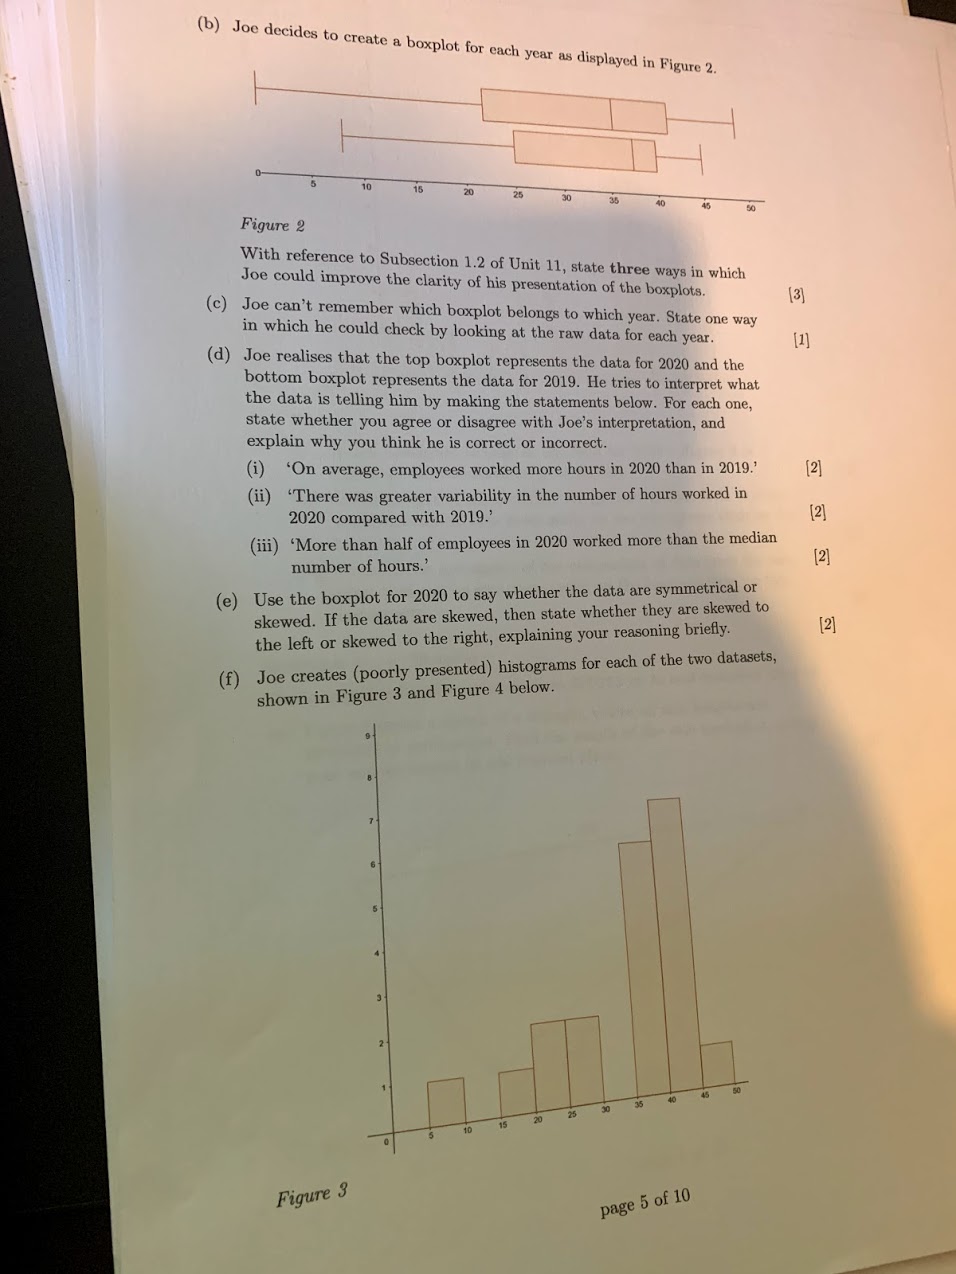
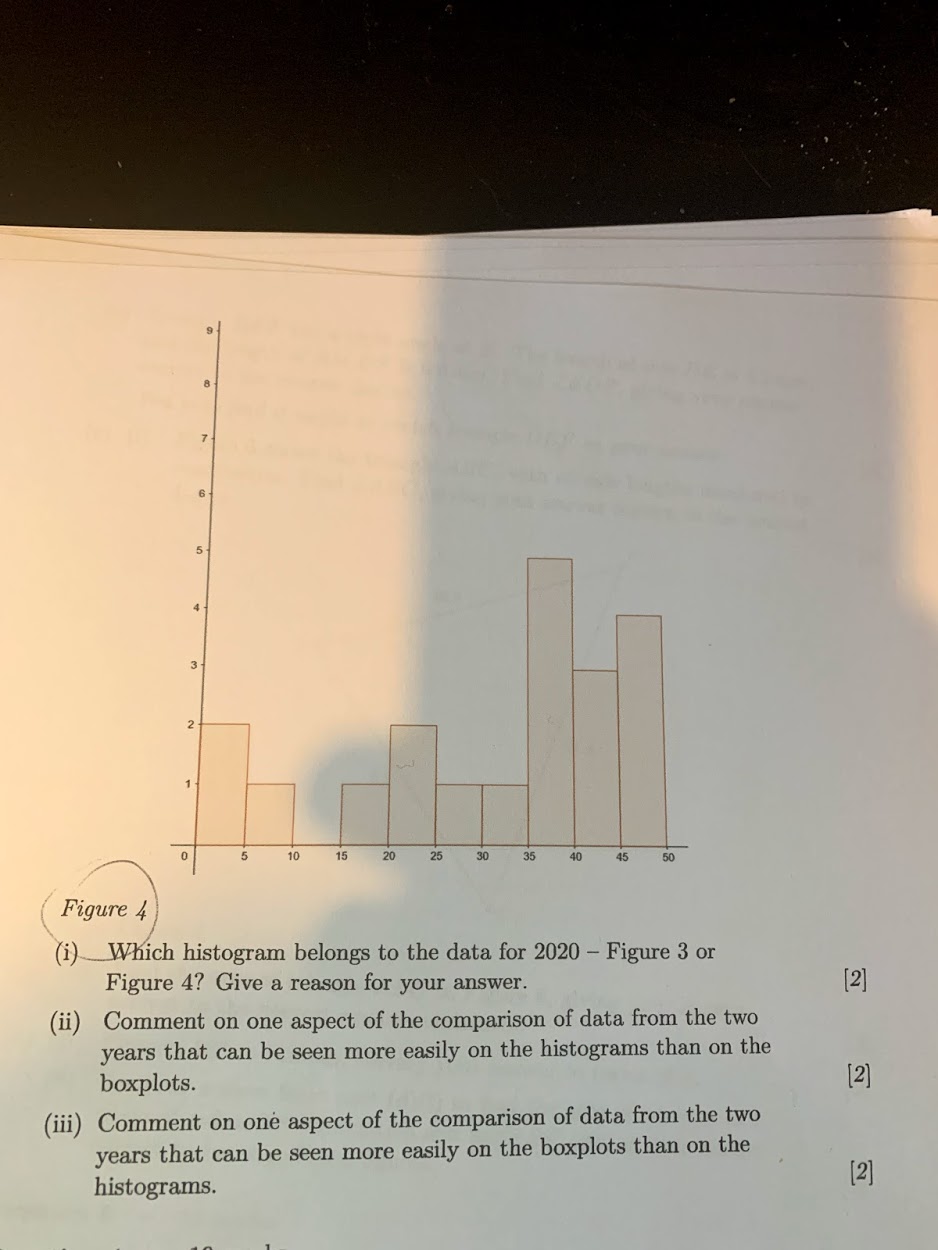
Question 3 [3] - 20 marks This question is based on your work on MU123 up to and including Unit 11. Joe works for a small company which employs 20 people. He is interested in investigating the effect of the COVID-19 pandemic on the number of hours worked by the company's employees. To get an initial sense of what the effect might be, he picks the first full working week in June 2019 and compares it with the equivalent week in June 2020. For each of the two chosen weeks, he downloads the number of working hours logged by each employee. The raw data are shown in Table 1. Table 1 Number of hours worked in the first full working week of June 2019 2020 8 0 16 0 23 8 24 16 25 20 25 24 35 28 36 32 36 35 37 35 38 36 39 37 40 38 40 40 40 41 40 42 42 45 42 47 43 48 45 49 Joe considers displaying the data as a pair of dotplots. Do you think (a) this is a good idea for these particular datasets? Give a brief reason for [2] your answer. page 4 of 10(b) Joe decides to create a boxplot for each year as displayed in Figure 2. Figure 2 With reference to Subsection 1.2 of Unit 11, state three ways in which Joe could improve the clarity of his presentation of the boxplots. [3] (c) Joe can't remember which boxplot belongs to which year. State one way in which he could check by looking at the raw data for each year. [1] (d) Joe realises that the top boxplot represents the data for 2020 and the bottom boxplot represents the data for 2019. He tries to interpret what the data is telling him by making the statements below. For each one, state whether you agree or disagree with Joe's interpretation, and explain why you think he is correct or incorrect. (i) 'On average, employees worked more hours in 2020 than in 2019.' [2] (ii) "There was greater variability in the number of hours worked in 2020 compared with 2019.' [2] (iii) 'More than half of employees in 2020 worked more than the median number of hours.' [2] (e) Use the boxplot for 2020 to say whether the data are symmetrical or skewed. If the data are skewed, then state whether they are skewed to the left or skewed to the right, explaining your reasoning briefly. [2] (f) Joe creates (poorly presented) histograms for each of the two datasets, shown in Figure 3 and Figure 4 below. Figure 3 page 5 of 107 6 5 3 10 15 20 25 30 35 40 45 50 Figure 4 i) Which histogram belongs to the data for 2020 - Figure 3 or Figure 4? Give a reason for your answer. [2] (ii) Comment on one aspect of the comparison of data from the two years that can be seen more easily on the histograms than on the boxplots. [2] (iii) Comment on one aspect of the comparison of data from the two years that can be seen more easily on the boxplots than on the [2] histograms


