HI, PLEASE I WOULD LIKE TO GET ANSWER FOR THESE QUESTIONS
- Please use Excel for statistical analysis. Relevant Excel statistical
- output must be properly analysed and interpreted. ( EXCEL IN THIS LINK = https://drive.google.com/file/d/1xxW4Sv5g7ep5qu62cMcjwzWKaF9h3CmB/view?usp=sharing )
- Please provide a number for every table, graph or figure used and make clear
- reference to the table/graph/figure in your discussion.
TASK1 : TABLE OF RANDOM NUMBERS: https://drive.google.com/file/d/1MXCKcIsT9nTFdh-pOjsxY_MvQGnS-04m/view?usp=sharing
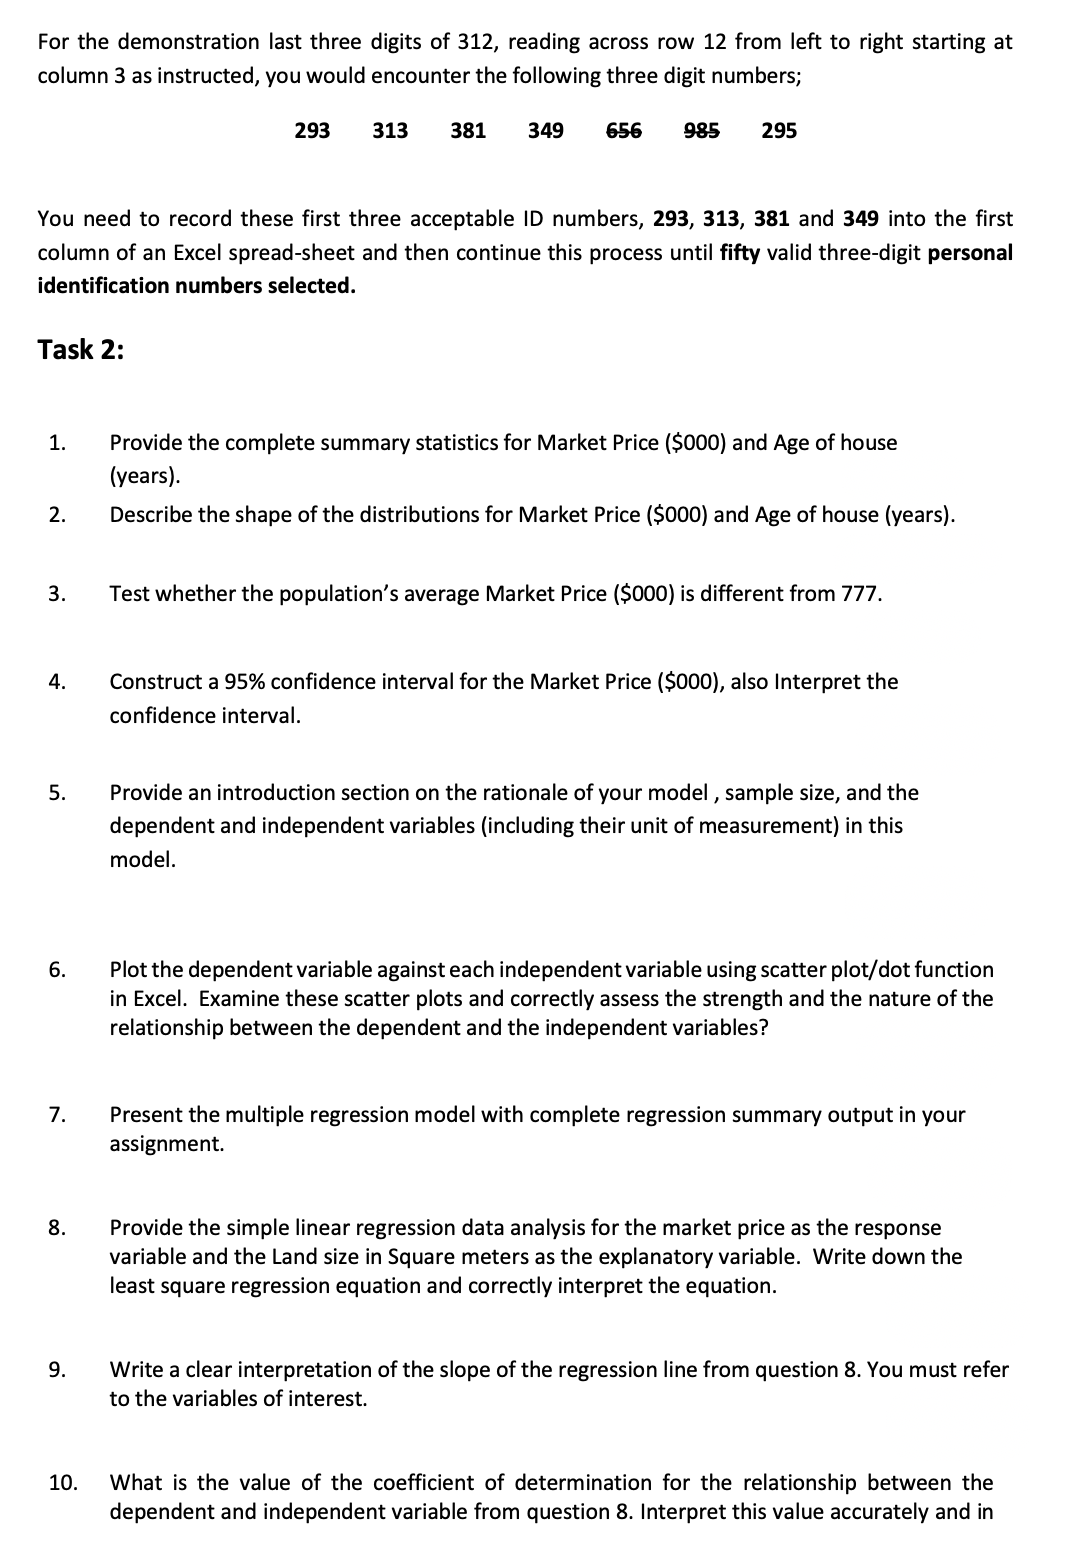
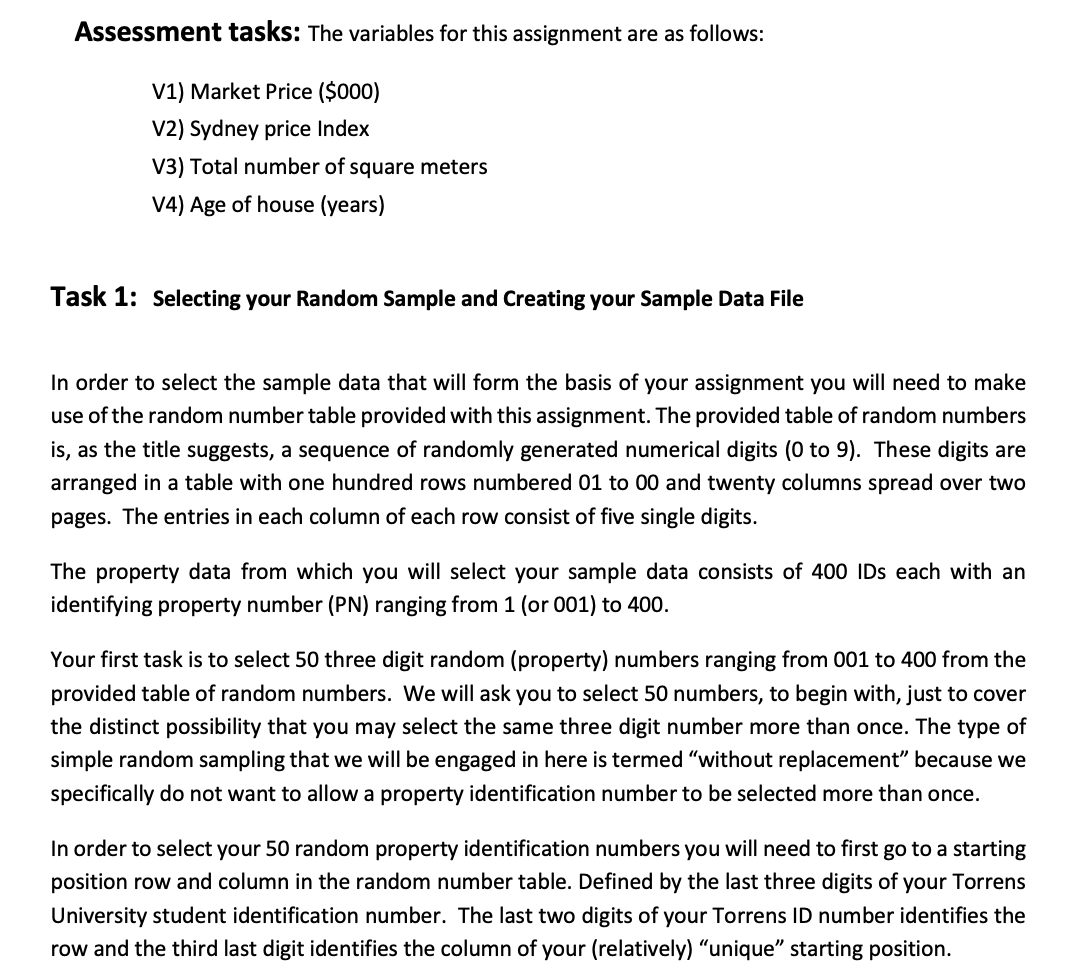
For the demonstration last three digits of 312, reading across row 12 from left to right starting at column 3 as instructed, you would encounter the following three digit numbers; 293 313 381 349 656 98-5 295 You need to record these first three acceptable ID numbers, 293, 313, 381 and 349 into the first column of an Excel spread-sheet and then continue this process until fty valid three-digit personal identication numbers selected. Task 2: 1. Provide the complete summary statistics for Market Price ($000} and Age of house (years). 2. Describe the shape of the distributions for Market Price ($000) and Age of house {years}. 3. Test whether the population's average Market Price ($000) is different from 777. 4. Construct a 95% confidence interval for the Market Price (5000), also Interpret the condence interval. 5. Provide an introduction section on the rationale of your model , sample size, and the dependent and independent variables (including their unit of measurement} in this model. 6. Plot the dependent variable against each independent variable using scatter plot/dot function in Excel. Examine these scatter plots and correctly assess the strength and the nature of the relationship between the dependent and the independent variables? 7. Present the multiple regression model with complete regression summary output in your assignment. 3. Provide the simple linear regression data analysis for the market price as the response variable and the Land size in Square meters as the explanatory variable. Write down the least square regression equation and correctly interpret the equation. 9. Write a clear interpretation of the slope of the regression line from question 3. You must refer to the variables of interest. 10. What is the value of the coefficient of determination for the relationship between the dependent and independent variable from question 3. Interpret this value accurately and in Assessment tasks: The variables for this assignment are as follows: V1) Market Price ($000) V2) Sydney price Index V3) Total number of square meters V4) Age of house (years) Task 1: Selecting your Random Sample and Creating your Sample Data File In order to select the sample data that will form the basis of your assignment you will need to make use ofthe random number table provided with this assignment. The provided table of random numbers is, as the title suggests, a sequence of randomly generated numerical digits (0 to 9). These digits are arranged in a table with one hundred rows numbered 01 to 00 and twenty columns spread over two pages. The entries in each column of each row consist of five single digits. The property data from which you will select your sample data consists of 400 IDs each with an identifying property number (PN) ranging from 1 (or 001) to 400. Your first task is to select 50 three digit random (property) numbers ranging from 001 to 400 from the provided table of random numbers. We will ask you to select 50 numbers, to begin with, just to cover the distinct possibility that you may select the same three digit number more than once. The type of simple random sampling that we will be engaged in here is termed "without replacement\" because we specifically do not want to allow a property identification number to be selected more than once. In order to select your 50 random property identification numbers you will need to rst go to a starting position row and column in the random number table. Defined by the last three digits of your Torrens University student identification number. The last two digits of your Torrens ID number identies the row and the third last digit identifies the column of your (relatively) \"unique\" starting position