Answered step by step
Verified Expert Solution
Question
1 Approved Answer
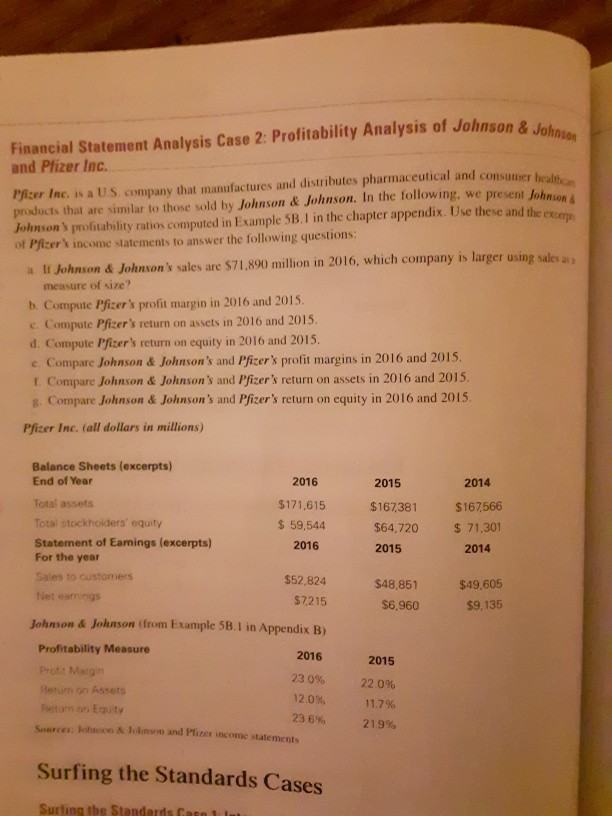
hnson Financial Statement Analysis Case 2. Profitability Analysis of Johnson & Johb and Pfizer Inc. Picer Inc. is a U.S. company that manufactures and distributes


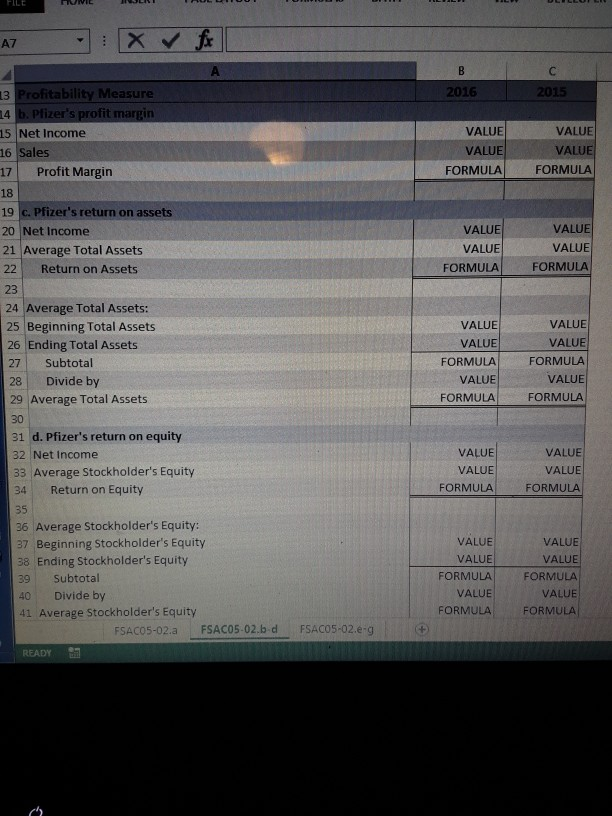
hnson Financial Statement Analysis Case 2. Profitability Analysis of Johnson & Johb and Pfizer Inc. Picer Inc. is a U.S. company that manufactures and distributes pharmaceutical and consumer health products that are similar to those sold by Johnson & Johnson. In the following, we present John Jolnson s profitability ratios computed in Example SB. I in the chapter appendix. Use these and the exeerp ot Pfcer's income statements to answer the following questions a Ii Johnson & Johnson's sales are $71,890 million in 2016, which company is larger using sales a measure of size? b. Compute Pfizer's profit margin in 2016 and 2015. e. Compute Pfizer's return on assets in 2016 and 2015. d. Compute Pfizer's return on equity in 2016 and 2015 e Compare Johnson& Johnson's and Pfizer's profit margins in 2016 and 2015. t. Compare Johnson & Johnson's and Pfizer's return on assets in 2016 and 2015. g. Compare Johnson & Johnson's and Pfizer's return on equity in 2016 and 2015 Pfizer Inc. (all dollars in millions) Balance Sheets (excerpts) End of Year Total assets Total stockhoiders' equity Statement of Earnings (excerpts) For the year Sales to customers 2016 $171,615 $ 59,544 2016 2015 $167,381 $64,720 2015 2014 $162566 71,301 2014 $52,824 $48,851 $6,960 $49,605 $9,135 $7,215 Johnson & Johnson tfrom Example 5B.1 in Appendix B) Profitability Measure Prott Margn 2016 230% 12.0% 23 696 2015 22.0% on Assets on Equity Sources: lotaeon & Joinson and Pfizer income statements 219% Surfing the Standards Cases Surting tbe Standerds Gase . A7 13 Profitability Measure 2015 14 15 Net Income VALUE VALUE FORMULA| VALUE VALUE FORMULA es 17 Profit Margin 18 19 c. Pfizer's return on assets 20 Net Income 21 Average Total Assets 22 Return on Assets 23 24 Average Total Assets: 25 Beginning Total Assets VALUE VALUE FORMULA VALUE VALUE FORMULA VALUE VALUE FORMULA VALUE FORMULA FORMULA VALUE VALUE FORMULA VALUE 26 Ending Total Assets 27 Subtotal 28 Divide by 29 Average Total Assets 30 31 d. Pfizer's return on equity 32 Net Income 33 Average Stockholder's Equity 34 Return on Equity VALUE VALUE FORMULA VALUE VALUE 35 36 Average Stockholder's Equity: 37 Beginning Stockholder's Equity 38 Ending Stockholder's Equity 39 Subtotal 40 Divide by 41 Average Stockholder's Equity VALUE VALUE VALUE VALUE FORMULA| FORMULA VALUE FORMULAFORMULA VALUE FSACO5-02.a FSAC05-02.b d FSACO5-02.e-g READY
Step by Step Solution
There are 3 Steps involved in it
Step: 1

Get Instant Access to Expert-Tailored Solutions
See step-by-step solutions with expert insights and AI powered tools for academic success
Step: 2

Step: 3

Ace Your Homework with AI
Get the answers you need in no time with our AI-driven, step-by-step assistance
Get Started


