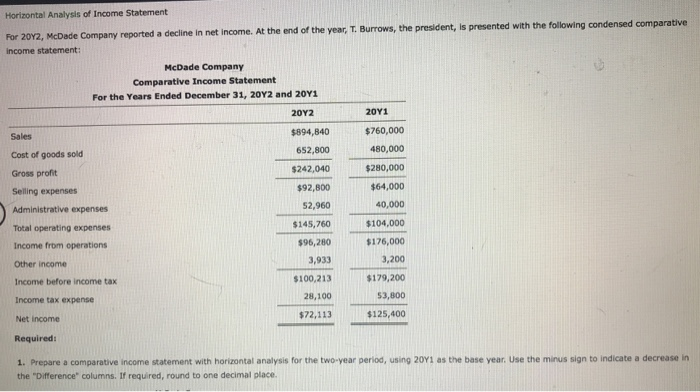
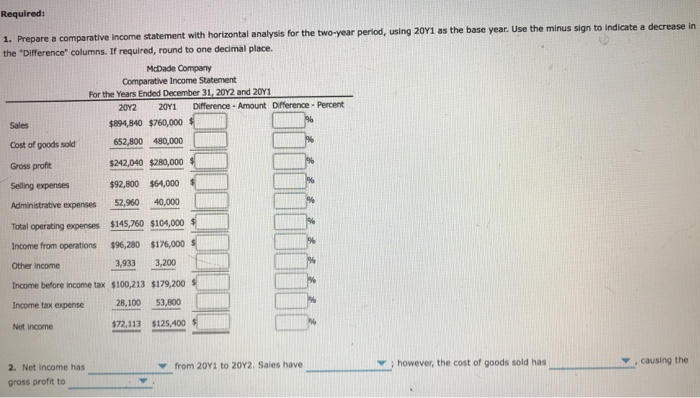
Horizontal Analysis of Income Statement For 2012, McDade Company reported a decline in net income. At the end of the year, T. Burrows, the president, is presented with the following condensed comparative Income statement: McDade Company Comparative Income Statement For the Years Ended December 31, 2012 and 2041 2012 2011 $894,840 652,800 $760,000 480,000 $242,040 $92,800 Cost of goods sold Gross profit Selling expenses Administrative expenses Total operating expenses Income from operations Other income $280,000 $64,000 40,000 52,960 $145,760 $104,000 $96,280 $176,000 3.200 Income before income tax 3,933 $100,213 28,100 $179,200 53,000 Income tax expense Net Income $72,113 $125,400 Required: 1. Prepare a comparative income statement with horizontal analysis for the two-year period, using 2011 as the base year. Use the minus sign to indicate a decrease in the Difference columns. If required, round to one decimal place Required: 1. Prepare a comparative Income statement with horizontal analysis for the two-year period, using 2011 as the base year. Use the minus sign to indicate a decrease in the "Difference columns. If required, round to one decimal place. McDade Company Comparative Income Statement For the Years Ended December 31, 2012 and 2041 2012 2011 Difference - Amount Difference - Percent Sales $894,840 $760,000 $ Cost of goods sold 652,800 480,000 Gross profit $242,040 $280,000 Selling expenses $92,800 $64,000 Administrative expenses 52,960 40,000 Total operating expenses $145,760 $104,000 Income from operations $96,280 $175,000 3,9333,200 Other income Income before income tax $100,213 $179,200 Income tax expense 28,100 $3,800 Net income 572.113 $125,400 S from 20Y1 to 2042, Sales have 2. Net Income has gross profit to ; however, the cost of goods sold has causing the Income tax experise 28,100 53,800 Net Income increased 125,400 decreased from 20Y1 to 2012. Sales have ; however, the cost of goods sold has causing the 2. Net income has gross profit to Income tax expense 53,800 Net Income $72,113 $125,400 Increased decreased from 20Y1 to 2042. Sales have however, the cost of goods sold has causing the 2. Net Income has gross profit to Income tax expense 28.100 5300 Net Income $72,113 $125,400 increased decreased from 2011 to 2012. Sales have however, the cost of goods sold has causing the 2. Net income has gross profit to Net Income $125,400 Increase decrease from 20Y1 to 2012. Sales have ; however, the cost of goods sold has causing the 2. Net Income has gross profit to


