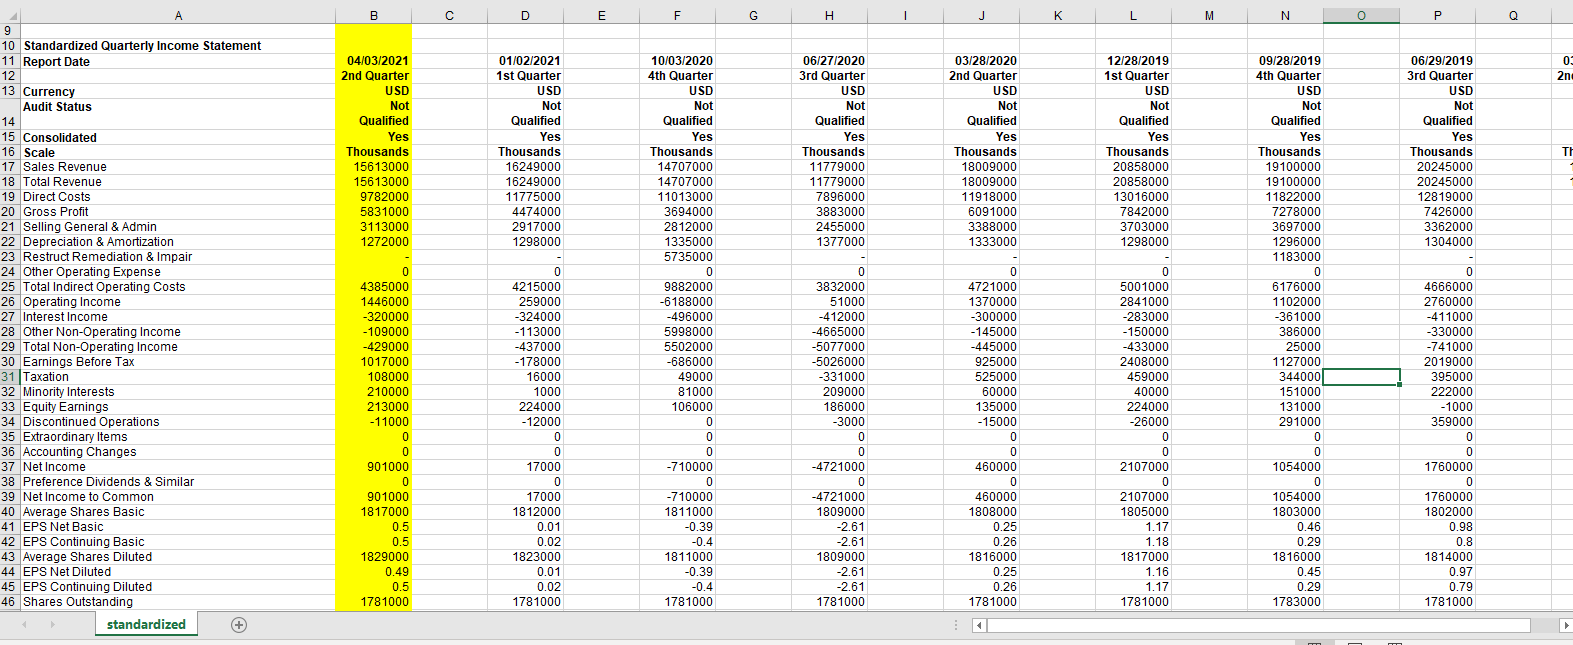
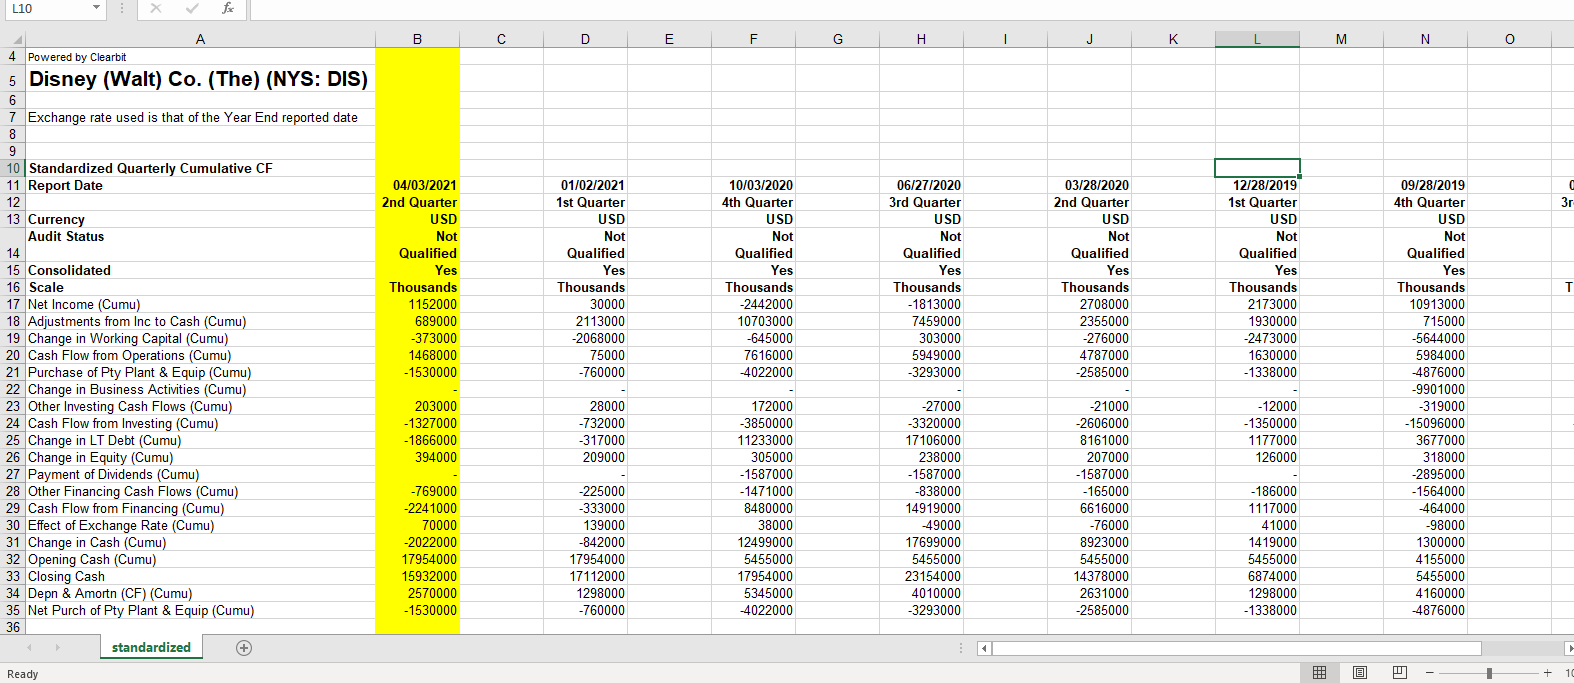
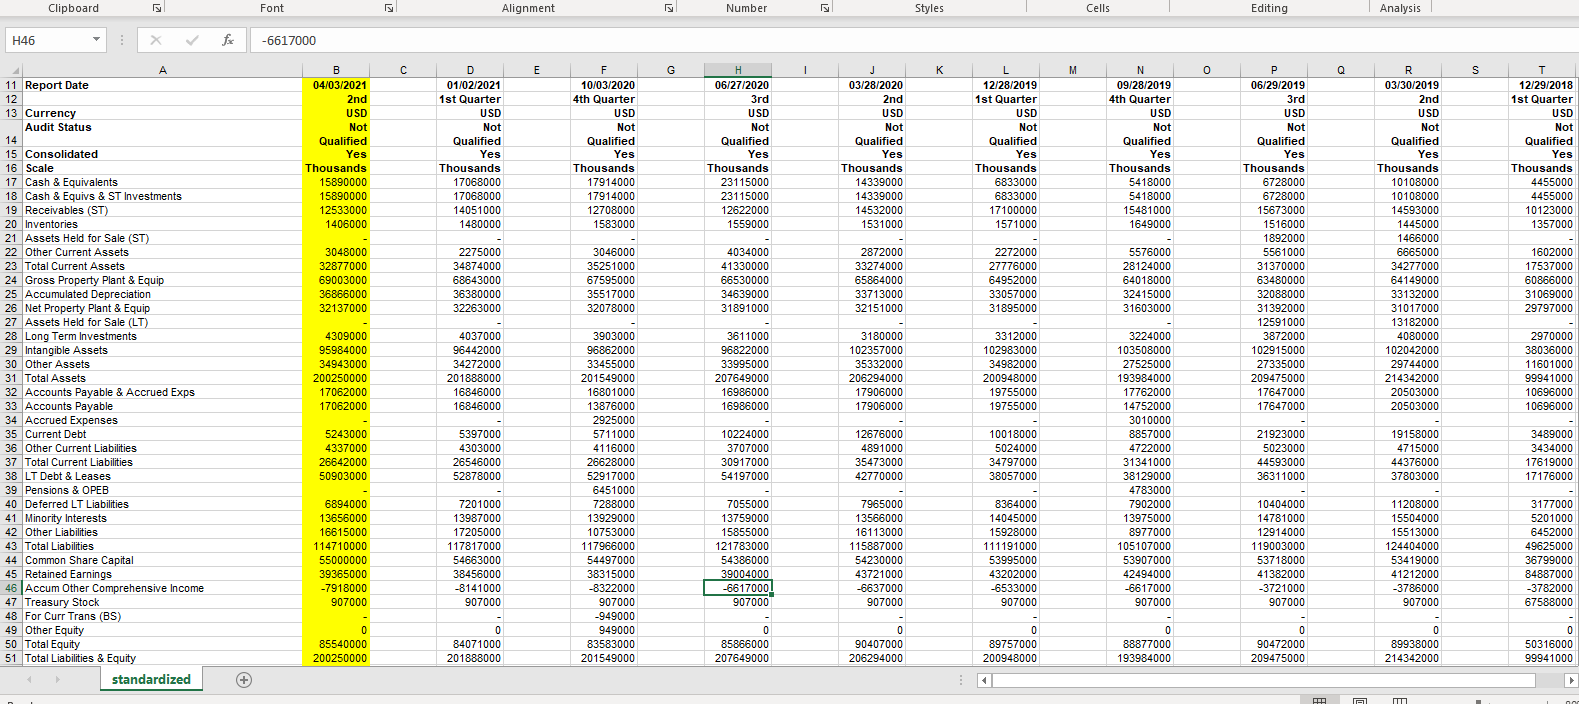
How do I located these on the financial statements? I can't figure these last two out on my spreadsheet .. I am using most recent quarter highlighted
I will attach the balance, cash flow, and income statements that I am using for Disney.
| PRICE EARNINGS RATIO (Share Price (end of quarter / EPS) |
| | | | | | |
| Stock Price | | | | | |
| EPS | | | | | |
| | | | | | |
| RETURN ON EQUITY (Net Income - Preferred Dividends / Shareholder's Equity) |
| | | | | | |
| NI - Pref. Div. | | | | |
| Shareholder's Equity | | | | |
| | | | | | |
Income Statement
Cash Flow Statement

Balance Sheet
B C D E F G . J L M N 0 P Q 03 2nd 04/03/2021 2nd Quarter USD Not Qualified Yes Thousands 15613000 15613000 9782000 5831000 3113000 1272000 01/02/2021 1st Quarter USD Not Qualified Yes Thousands 16249000 16249000 11775000 4474000 2917000 1298000 06/27/2020 3rd Quarter USD Not Qualified Yes Thousands 11779000 11779000 7896000 3883000 2455000 1377000 03/28/2020 2nd Quarter USD Not Qualified Yes Thousands 18009000 18009000 11918000 6091000 3388000 1333000 06/29/2019 3rd Quarter USD Not Qualified Yes Thousands 20245000 20245000 12819000 7426000 3362000 1304000 TH A 9 10 Standardized Quarterly Income Statement 11 Report Date 12 13 Currency Audit Status 14 15 Consolidated 16 Scale 17 Sales Revenue 18 Total Revenue 19 Direct Costs 20 Gross Profit 21 Selling General & Admin 22 Depreciation & Amortization 23 Restruct Remediation & Impair 24 Other Operating Expense 25 Total Indirect Operating Costs 26 Operating Income 27 Interest Income 28 Other Non-Operating Income 29 Total Non-Operating Income 30 Earnings Before Tax 31 Taxation 32 Minority Interests 33 Equity Earnings 34 Discontinued Operations 35 Extraordinary Items 36 Accounting Changes 37 Net Income 38 Preference Dividends & Similar 39 Net Income to Common 40 Average Shares Basic 41 EPS Net Basic 42 EPS Continuing Basic 43 Average Shares Diluted 44 EPS Net Diluted 45 EPS Continuing Diluted 46 Shares Outstanding standardized 0 4721000 1370000 -300000 -145000 10/03/2020 4th Quarter USD Not Qualified Yes Thousands 14707000 14707000 11013000 3694000 2812000 1335000 5735000 0 9882000 -6188000 -496000 5998000 5502000 -686000 49000 81000 106000 0 0 0 -710000 0 -710000 1811000 -0.39 -0.4 1811000 -0.39 -0.4 1781000 0 4385000 1446000 -320000 -109000 -429000 1017000 108000 210000 213000 -11000 0 0 901000 0 901000 1817000 0.5 0.5 1829000 0.49 0.5 1781000 0 4215000 259000 -324000 - 113000 -437000 -178000 16000 1000 224000 - 12000 0 0 17000 0 17000 1812000 0.01 0.02 1823000 0.01 0.02 1781000 -445000 12/28/2019 1st Quarter USD Not Qualified Yes Thousands 20858000 20858000 13016000 7842000 3703000 1298000 - 0 5001000 2841000 -283000 - 150000 -433000 2408000 459000 40000 224000 -26000 0 0 2107000 0 2107000 1805000 1.17 1.18 1817000 1.16 1.17 1781000 0 3832000 51000 -412000 -4665000 -5077000 -5026000 -331000 209000 186000 -3000 0 0 -4721000 0 -4721000 1809000 -2.61 -2.61 1809000 -2.61 -2.61 1781000 09/28/2019 4th Quarter USD Not Qualified Yes Thousands 19100000 19100000 11822000 7278000 3697000 1296000 1183000 0 6176000 1102000 -361000 386000 25000 1127000 3440001 151000 131000 291000 0 0 1054000 0 1054000 1803000 0.46 0.29 1816000 0.45 0.29 1783000 925000 525000 60000 135000 - 15000 0 0 460000 0 460000 1808000 0.25 0 4666000 2760000 -411000 -330000 -741000 2019000 395000 222000 -1000 359000 0 0 1760000 0 1760000 1802000 0.98 0.8 1814000 0.97 0.79 1781000 0.26 1816000 0.25 0.26 1781000 L10 fie B C D E F G H . I J K L M N O 3r 4 Powered by Clearbit 5 Disney (Walt) Co. (The) (NYS: DIS) 6 7 Exchange rate used is that of the Year End reported date 8 9 10 Standardized Quarterly Cumulative CF 11 Report Date 12 13 Currency Audit Status 14 15 Consolidated 16 Scale 17 Net Income (Cumu) 18 Adjustments from Inc to Cash (Cumu) 19 Change in Working Capital (Cumu) 20 Cash Flow from Operations (Cumu) 21 Purchase of Pty Plant & Equip (Cumu) 22 Change in Business Activities (Cumu) 23 Other Investing Cash Flows (Cumu) 24 Cash Flow from Investing (Cumu) 25 Change in LT Debt (Cumu) 26 Change in Equity (Cumu) 27 Payment of Dividends (Cumu) 28 Other Financing Cash Flows (Cumu) 29 Cash Flow from Financing (Cumu) 30 Effect of Exchange Rate (Cumu) 31 Change in Cash (Cumu) 32 Opening Cash (Cumu) 33 Closing Cash 34 Depn & Amortn (CF) (Cumu) 35 Net Purch of Pty Plant & Equip (Cumu) 36 standardized + 04/03/2021 2nd Quarter USD Not Qualified Yes Thousands 1152000 689000 -373000 1468000 -1530000 01/02/2021 1st Quarter USD Not Qualified Yes Thousands 30000 2113000 -2068000 75000 -760000 10/03/2020 4th Quarter USD Not Qualified Yes Thousands -2442000 10703000 -645000 7616000 -4022000 06/27/2020 3rd Quarter USD Not Qualified Yes Thousands -1813000 7459000 303000 5949000 -3293000 03/28/2020 2nd Quarter USD Not Qualified Yes Thousands 2708000 2355000 -276000 4787000 -2585000 12/28/2019 1st Quarter USD Not Qualified Yes Thousands 2173000 1930000 -2473000 1630000 -1338000 T 09/28/2019 4th Quarter USD Not Qualified Yes Thousands 10913000 715000 -5644000 5984000 -4876000 -9901000 -319000 -15096000 3677000 318000 -2895000 -1564000 464000 -98000 1300000 4155000 5455000 4160000 -4876000 203000 -1327000 -1866000 394000 28000 -732000 -317000 209000 - 12000 -1350000 1177000 126000 -769000 -2241000 70000 -2022000 17954000 15932000 2570000 -1530000 172000 -3850000 11233000 305000 -1587000 -1471000 8480000 38000 12499000 5455000 17954000 5345000 -4022000 -225000 -333000 139000 -842000 17954000 17112000 1298000 -760000 -27000 -3320000 17106000 238000 -1587000 -838000 14919000 49000 17699000 5455000 23154000 4010000 -3293000 -21000 -2606000 8161000 207000 - 1587000 - 165000 6616000 -76000 8923000 5455000 14378000 2631000 -2585000 -186000 1117000 41000 1419000 5455000 6874000 1298000 -1338000 Ready Clipboard Font Alignment Number Styles Cells Editing Analysis H46 fx -6617000 E G 1 K M 0 Q S B 04/03/2021 2nd USD Not Qualified Yes Thousands 15890000 15890000 12533000 1406000 D 01/02/2021 1st Quarter USD Not Qualified Yes Thousands 17068000 17068000 14051000 1480000 F 10/03/2020 4th Quarter USD Not Qualified Yes Thousands 17914000 17914000 12708000 1583000 H 06/27/2020 3rd USD Not Qualified Yes Thousands 23115000 23115000 12622000 1559000 J 03/28/2020 2nd USD Not Qualified Yes Thousands 14339000 14339000 14532000 1531000 L 12/28/2019 1st Quarter USD Not Qualified Yes Thousands 6833000 6833000 17100000 1571000 N 09/28/2019 4th Quarter USD Not Qualified Yes Thousands 5418000 5418000 15481000 1649000 T 12/29/2018 1st Quarter USD Not Qualified Yes Thousands 4455000 4455000 10123000 1357000 P 06/29/2019 3rd USD Not Qualified Yes Thousands 6728000 6728000 15673000 1516000 1892000 5561000 31370000 63480000 32088000 31392000 12591000 3872000 102915000 27335000 209475000 17647000 17647000 R. 03/30/2019 2nd USD Not Qualified Yes Thousands 10108000 10108000 14593000 1445000 1466000 6665000 34277000 64149000 33132000 31017000 13182000 4080000 102042000 29744000 214342000 20503000 20503000 3048000 32877000 69003000 36866000 32137000 2275000 34874000 68643000 36380000 32263000 3046000 35251000 67595000 35517000 32078000 4034000 41330000 66530000 34639000 31891000 2872000 33274000 65864000 33713000 32151000 2272000 27776000 64952000 33057000 31895000 11 Report Date 12 13 Currency Audit Status 14 15 Consolidated 16 Scale 17 Cash & Equivalents 18 Cash & Equivs & ST Investments 19 Receivables (ST) 20 Inventories 21 Assets Held for Sale (ST) 22 Other Current Assets 23 Total Current Assets 24 Gross Property Plant & Equip 25 Accumulated Depreciation 26 Net Property Plant & Equip 27 Assets Held for Sale (LT) 28 Long Term Investments 29 Intangible Assets 30 Other Assets 31 Total Assets 32 Accounts Payable & Accrued Exps 33 Accounts Payable 34 Accrued Expenses 35 Current Debt 36 Other Current Liabilities 37 Total Current Liabilities 38 LT Debt & Leases 39 Pensions & OPEB 40 Deferred LT Liabilities 41 Minority Interests 42 Other Liabilities 43 Total Liabilities 44 Common Share Capital 45 Retained Earnings 46 Accum Other Comprehensive Income 47 Treasury Stock 48 For Curr Trans (BS) 49 Other Equity 50 Total Equity 51 Total Liabilities & Equity standardized 5576000 28124000 64018000 32415000 31603000 1602000 17537000 60866000 31069000 29797000 4309000 95984000 34943000 200250000 17062000 17062000 4037000 96442000 34272000 201888000 16846000 16846000 3611000 96822000 33995000 207649000 16986000 16986000 3180000 102357000 35332000 206294000 17906000 17906000 3312000 102983000 34982000 200948000 19755000 19755000 - 10018000 5024000 34797000 38057000 2970000 38036000 11601000 99941000 10696000 10696000 21923000 5243000 4337000 26642000 50903000 5397000 4303000 26546000 52878000 10224000 3707000 30917000 54197000 12676000 4891000 35473000 42770000 3224000 103508000 27525000 193984000 17762000 14752000 3010000 8857000 4722000 31341000 38129000 4783000 7902000 13975000 8977000 105107000 53907000 42494000 -6617000 907000 5023000 44593000 36311000 19158000 4715000 44376000 37803000 3489000 3434000 17619000 17176000 6894000 13656000 16615000 114710000 55000000 39365000 -7918000 907000 - 0 85540000 200250000 3903000 96862000 33455000 201549000 16801000 13876000 2925000 5711000 4116000 26628000 52917000 6451000 7288000 13929000 10753000 117966000 54497000 38315000 -8322000 907000 -949000 949000 83583000 201549000 7201000 13987000 17205000 117817000 54663000 38456000 -8141000 907000 7055000 13759000 15855000 121783000 54386000 39004000 -6617000 907000 7965000 13566000 16113000 115887000 54230000 43721000 -6637000 907000 8364000 14045000 15928000 111191000 53995000 43202000 -6533000 907000 10404000 14781000 12914000 119003000 53718000 41382000 -3721000 907000 11208000 15504000 15513000 124404000 53419000 41212000 -3786000 907000 - 0 89938000 214342000 3177000 5201000 6452000 49625000 36799000 84887000 -3782000 67588000 0 84071000 201888000 0 85866000 207649000 0 90407000 206294000 0 89757000 200948000 7 0 88877000 193984000 0 90472000 209475000 0 50316000 99941000 + A M


