Answered step by step
Verified Expert Solution
Link Copied!

Question

1 Approved Answer

How do you solve this with StatCrunch? Question Help Conduct the hypothesis test and provide the test statistic and the critical value, and state the

How do you solve this with StatCrunch?
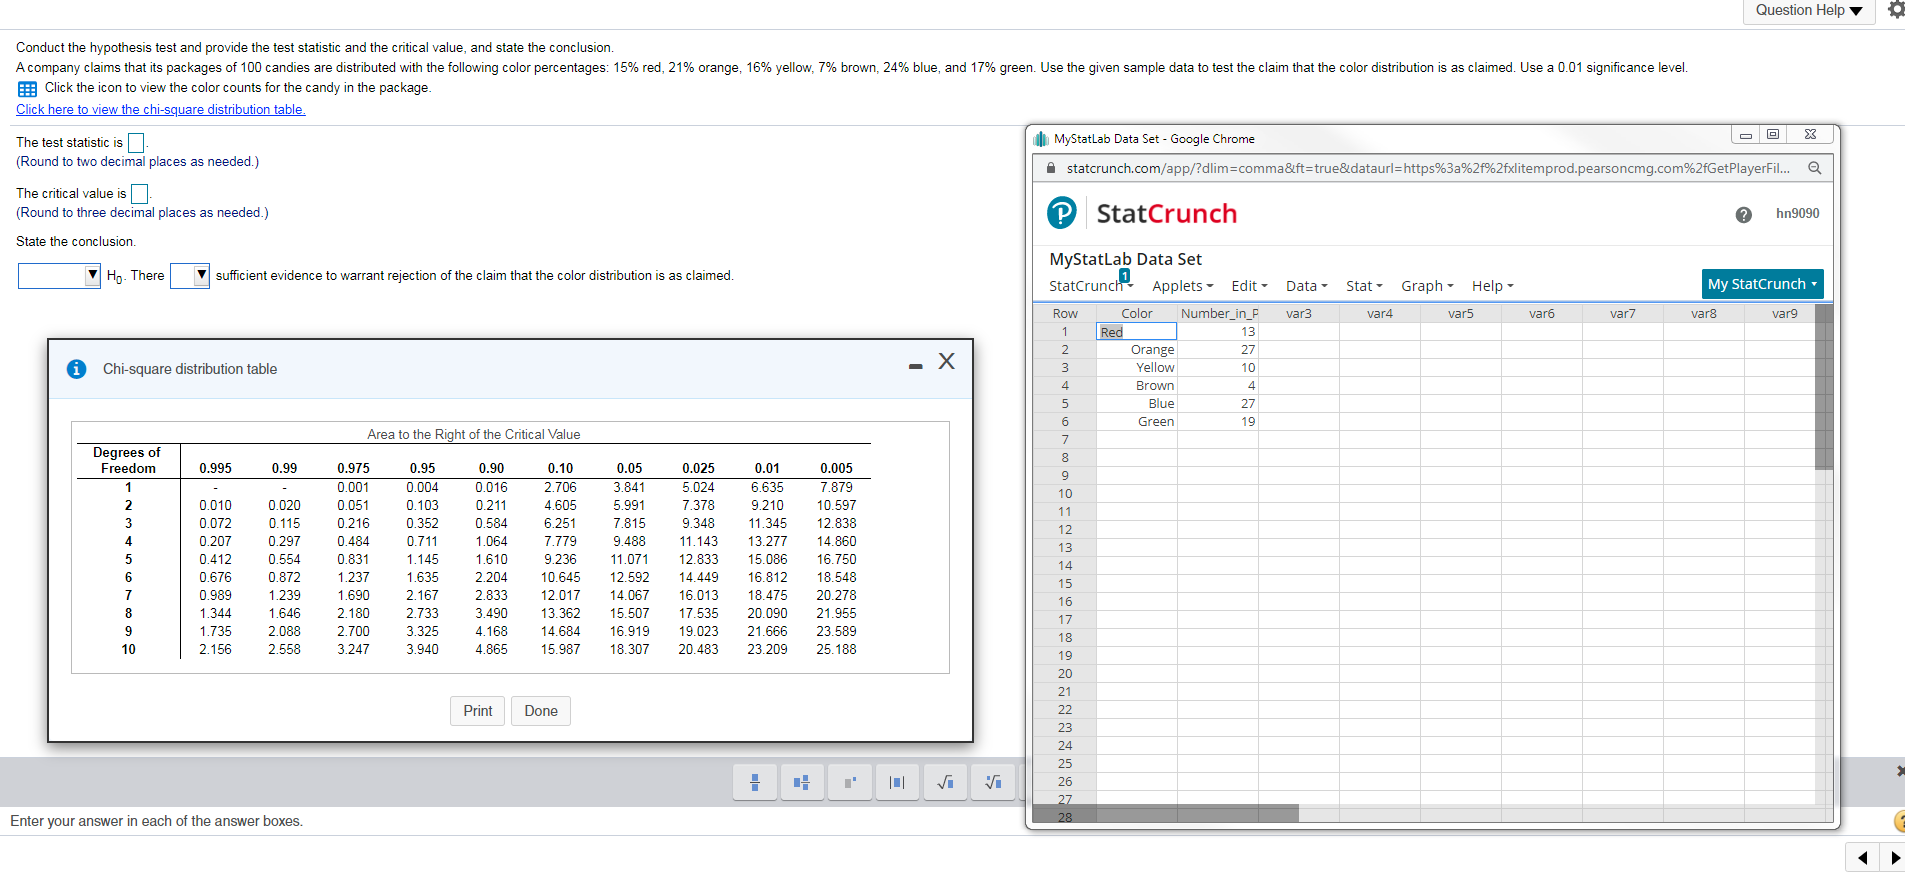
image text in transcribed
Question Help Conduct the hypothesis test and provide the test statistic and the critical value, and state the conclusion. A company claims that its packages of 100 candies are distributed with the following color percentages: 15% red, 21% orange, 16% yellow, 7% brown, 24% blue, and 17% green. Use the given sample data to test the claim that the color distribution is as claimed. Use a 0.01 significance level. Click the icon to view the color counts for the candy in the package. Click here to view the chi-square distribution table. -O X The test statistic is MyStatLab Data Set - Google Chrome (Round to two decimal places as needed.) "statcrunch.com/app/?dlim=comma&ft=true&dataurl=https%3a%2f%2fxlitemprod.pearsoncmg.com%2fGetPlayerFil... The critical value is P StatCrunch ? hn9090 (Round to three decimal places as needed.) State the conclusion. MyStatLab Data Set Hp. There sufficient evidence to warrant rejection of the claim that the color distribution is as claimed. StatCrunch Applets - Edit - Data - Stat - Graph . Help My StatCrunch Row Color Number_in_P var3 var4 var5 var6 var7 var8 var9 1 Rec 13 Orange 27 10 i Chi-square distribution table - Yellow Brown 4 YOUA WN Blue 27 Green 19 Area to the Right of the Critical Value Degrees of 8 Freedom 0.995 0.99 0.975 0.95 0.90 0.10 0.05 0.025 0.01 0.005 0.001 0.004 0.016 2.706 3.841 5.024 6.635 7.879 10 0.010 0.020 0.051 0.103 0.211 4.605 5.991 7.378 9.210 10.597 11 0.072 0.115 0.216 0.352 0.584 6.251 7.815 9.348 11.345 12.838 12 0.207 0.297 0.484 0.711 1.064 7.779 9.488 11.143 13.277 14.860 13 0.412 0.554 0.831 1.145 1.610 9.236 11.071 12.833 15.086 16.750 14 0.676 0.872 1.237 1.635 2.204 10.645 12.592 14.449 16.812 18.548 0.989 1.239 1.690 2.167 2.833 12.017 14.067 16.013 18.475 20.278 1.344 1.646 2.180 2.733 3.490 13.362 15.507 17.535 20.090 21.955 1.735 2.088 2.700 3.325 4.168 14.684 16.919 19.023 21.666 23.589 18 2.156 2.558 3.247 3.940 4.865 15.987 18.307 20.483 23.209 25.188 19 20 21 Print Done 22 23 24 25 Vi Vi 26 128 Enter your answer in each of the answer boxes

Step by Step Solution

There are 3 Steps involved in it

Step: 1

blur-text-image

Get Instant Access to Expert-Tailored Solutions

See step-by-step solutions with expert insights and AI powered tools for academic success

Step: 2

blur-text-image

Step: 3

blur-text-image

Ace Your Homework with AI

Get the answers you need in no time with our AI-driven, step-by-step assistance

Get Started

Recommended Textbook for

Algebra And Trigonometry Enhanced With Graphing Utilities (Subscription)

Authors: Michael, Michael Sullivan III, Michael III Sullivan, Michael Sullivan 111, III Sullivan

6th Edition

0321849132, 9780321849137

More Books

Students also viewed these Mathematics questions

Question

1. Are my sources credible?

Answered: 1 week ago

Question

3. Are my sources accurate?

Answered: 1 week ago

Question

1. Is it a topic you are interested in and know something about?

Answered: 1 week ago