how to prepare statement of cash flows

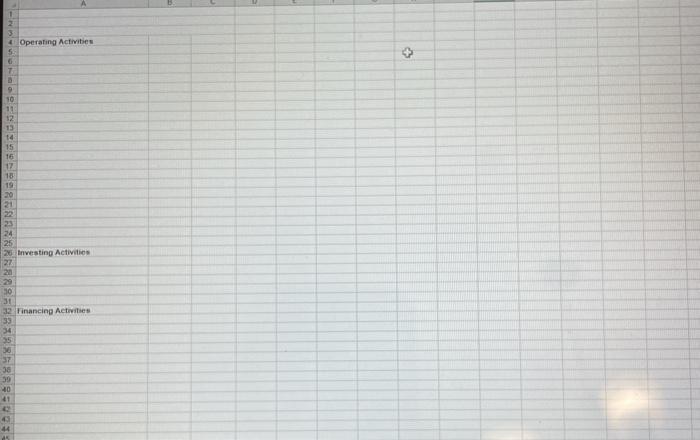
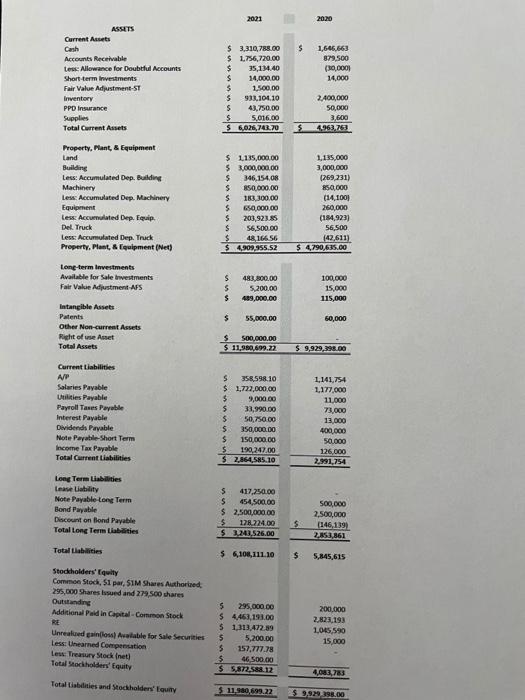
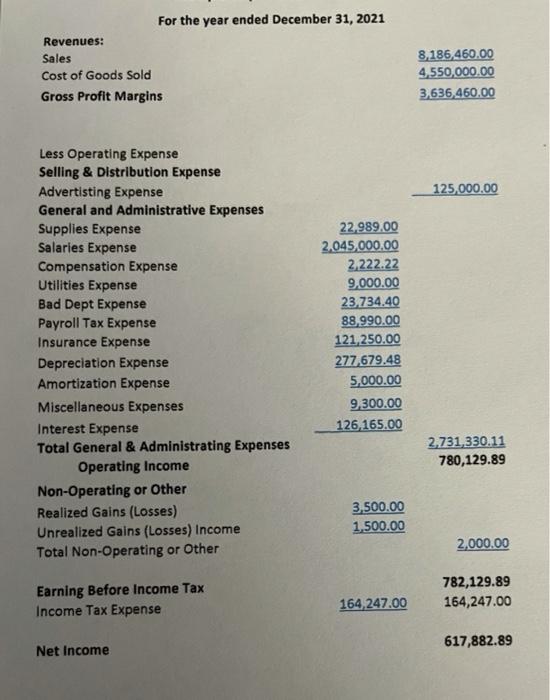
1 4 Operating Activities 5 6 7 + 9 10 11 12 13 14 15 16 17 19 20 21 33 25 20 Investing Activities 30 31 32 Financing Activities 39 36 38 39 40 41 44 2021 2010 $ ASSETS Current Assets Cash Accounts Receivable tes: Allowance for Doubtful Accounts Short-term investments Fair Value Adjustment-ST Inventory PPD Insurance Supplies Total Current Assets 1,646,663 879,500 (30,000 14,000 $ 3,310,788.00 $ 1.756,720.00 $ 35,134.40 14,000.00 $ 1.500,00 $ 933,101,10 5 43,750,00 s 5.616.00 $ 6,026,742.70 2,400,000 50,000 3,600 4.963.251 Property. Plant, & Equipment Land Building Less: Accumulated Dep. Building Machinery Less: Accumulated Dep. Machinery Equipment Less: Accumulated Dep. Equip Del Truck Less: Accumulated Dep. Truck Property. Plant & Equipment (Net) $ 1135,000.00 5 3,000,000.00 $ 346,15408 $ 850,000.00 $ 183,300.00 $ 650,000.00 $ 203,923.85 $ $6,500.00 $ 48.166.56 $ 4,909,855.52 1.135.000 3,000,000 (269.231) 850,000 (14,100) 260,000 (184,923) 56,500 (42,611) $ 4790,615.00 Long-term investments Available for Sale rivestments Fair Vokie Adjustment AFS 5 $ $ 483,800.00 5,200.00 489,000.00 100,000 15.000 115,000 $ 55,000.00 50,000 Intangible Assets Patents Other Non-current Assets Right of use Asset Total Assets s 500.000,00 $ 11,980,699.22 $ 9,929,398.00 Current Liabilities AP Salaries Payable Utilities Payable Payroll Taxes Payable Interest Payable Dividends Payable Note Payable-Short Term Income Tax Payable Total Current Liabilities 5 358,598.10 $ 1,722,000.00 $ 9,000.00 5 33,990.00 5 50,750.00 S 350,000.00 $ 150,000.00 $ 190,247.00 $ 2,864,585.10 1,141,754 1,177,000 11.000 73,000 13,000 400.000 50,000 126,000 2.991,754 Long Term Liabilities Lease Liability Note Payable Long Term Bond Payable Discount on Blond Payable Total Long Term Labaties 5 417,250,00 $ 454,500.00 $ 2,500,000.00 $ 128.224.00 $ 2241,526.00 500,000 2,500,000 (146,139 2,853,861 s Total Liabilities $ 6,108,111.10 $ 5,845,615 Stockholders' Equity Comen Stock, 51 par, SIM Shares Authorized 295,000 Shares issued and 279,500 shares Outstanding Additional Paldin Capital - Common Stock RE Unreld gainos Alable for Sale Securities Less: Unearned Compensation Les Treasury Stockineti Total Stockholders' Equity 5 295,000.00 $ 4,463,198.00 $ 1,313,472.89 5 5,200.00 $ 157,777.78 $ 46,500.00 $ 5872.588.12 200.000 2,823,193 1.045,590 15.000 4081783 Total Liabilities and stod holders' Equity 11.980.699.22 $9.929298.00 For the year ended December 31, 2021 Revenues: Sales Cost of Goods Sold Gross Profit Margins 8,186,460.00 4,550,000.00 3,636 460.00 125,000.00 Less Operating Expense Selling & Distribution Expense Advertisting Expense General and Administrative Expenses Supplies Expense Salaries Expense Compensation Expense Utilities Expense Bad Dept Expense Payroll Tax Expense Insurance Expense Depreciation Expense Amortization Expense Miscellaneous Expenses Interest Expense Total General & Administrating Expenses Operating Income Non-Operating or Other Realized Gains (Losses) Unrealized Gains (Losses) Income Total Non-Operating or Other 22,989.00 2.045,000.00 2,222.22 9,000.00 23.734.40 88,990.00 121,250.00 277,679.48 5,000.00 9,300.00 126,165.00 2.731.330.11 780,129.89 3,500.00 1.500.00 2,000.00 Earning Before Income Tax Income Tax Expense 782,129.89 164,247.00 164,247.00 617,882.89 Net Income 1 4 Operating Activities 5 6 7 + 9 10 11 12 13 14 15 16 17 19 20 21 33 25 20 Investing Activities 30 31 32 Financing Activities 39 36 38 39 40 41 44 2021 2010 $ ASSETS Current Assets Cash Accounts Receivable tes: Allowance for Doubtful Accounts Short-term investments Fair Value Adjustment-ST Inventory PPD Insurance Supplies Total Current Assets 1,646,663 879,500 (30,000 14,000 $ 3,310,788.00 $ 1.756,720.00 $ 35,134.40 14,000.00 $ 1.500,00 $ 933,101,10 5 43,750,00 s 5.616.00 $ 6,026,742.70 2,400,000 50,000 3,600 4.963.251 Property. Plant, & Equipment Land Building Less: Accumulated Dep. Building Machinery Less: Accumulated Dep. Machinery Equipment Less: Accumulated Dep. Equip Del Truck Less: Accumulated Dep. Truck Property. Plant & Equipment (Net) $ 1135,000.00 5 3,000,000.00 $ 346,15408 $ 850,000.00 $ 183,300.00 $ 650,000.00 $ 203,923.85 $ $6,500.00 $ 48.166.56 $ 4,909,855.52 1.135.000 3,000,000 (269.231) 850,000 (14,100) 260,000 (184,923) 56,500 (42,611) $ 4790,615.00 Long-term investments Available for Sale rivestments Fair Vokie Adjustment AFS 5 $ $ 483,800.00 5,200.00 489,000.00 100,000 15.000 115,000 $ 55,000.00 50,000 Intangible Assets Patents Other Non-current Assets Right of use Asset Total Assets s 500.000,00 $ 11,980,699.22 $ 9,929,398.00 Current Liabilities AP Salaries Payable Utilities Payable Payroll Taxes Payable Interest Payable Dividends Payable Note Payable-Short Term Income Tax Payable Total Current Liabilities 5 358,598.10 $ 1,722,000.00 $ 9,000.00 5 33,990.00 5 50,750.00 S 350,000.00 $ 150,000.00 $ 190,247.00 $ 2,864,585.10 1,141,754 1,177,000 11.000 73,000 13,000 400.000 50,000 126,000 2.991,754 Long Term Liabilities Lease Liability Note Payable Long Term Bond Payable Discount on Blond Payable Total Long Term Labaties 5 417,250,00 $ 454,500.00 $ 2,500,000.00 $ 128.224.00 $ 2241,526.00 500,000 2,500,000 (146,139 2,853,861 s Total Liabilities $ 6,108,111.10 $ 5,845,615 Stockholders' Equity Comen Stock, 51 par, SIM Shares Authorized 295,000 Shares issued and 279,500 shares Outstanding Additional Paldin Capital - Common Stock RE Unreld gainos Alable for Sale Securities Less: Unearned Compensation Les Treasury Stockineti Total Stockholders' Equity 5 295,000.00 $ 4,463,198.00 $ 1,313,472.89 5 5,200.00 $ 157,777.78 $ 46,500.00 $ 5872.588.12 200.000 2,823,193 1.045,590 15.000 4081783 Total Liabilities and stod holders' Equity 11.980.699.22 $9.929298.00 For the year ended December 31, 2021 Revenues: Sales Cost of Goods Sold Gross Profit Margins 8,186,460.00 4,550,000.00 3,636 460.00 125,000.00 Less Operating Expense Selling & Distribution Expense Advertisting Expense General and Administrative Expenses Supplies Expense Salaries Expense Compensation Expense Utilities Expense Bad Dept Expense Payroll Tax Expense Insurance Expense Depreciation Expense Amortization Expense Miscellaneous Expenses Interest Expense Total General & Administrating Expenses Operating Income Non-Operating or Other Realized Gains (Losses) Unrealized Gains (Losses) Income Total Non-Operating or Other 22,989.00 2.045,000.00 2,222.22 9,000.00 23.734.40 88,990.00 121,250.00 277,679.48 5,000.00 9,300.00 126,165.00 2.731.330.11 780,129.89 3,500.00 1.500.00 2,000.00 Earning Before Income Tax Income Tax Expense 782,129.89 164,247.00 164,247.00 617,882.89 Net Income


