

Answered step by step
Verified Expert Solution
Question
1 Approved Answer
https://www.dropbox.com/sh/hqawrnmfof5bpmb/AAC4abunkv_tFdP5gP14Tb7La?dl=0 Can anyone step-step help me with this cs lab question? 14 Add the Date field to the Filters area, add Qperator..e to the Rows
https://www.dropbox.com/sh/hqawrnmfof5bpmb/AAC4abunkv_tFdP5gP14Tb7La?dl=0
Can anyone step-step help me with this cs lab question?
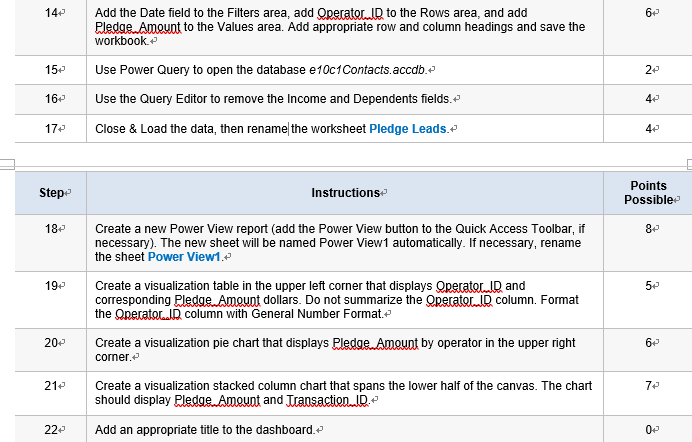
14 Add the Date field to the Filters area, add Qperator..e to the Rows area, and ado 64 Pledae Amount to the Values area. Add appropriate row and column headings and save the workbook.P 15 Use Power Query to open the database e10c1Contacts.accdb.+ 16- Use the Query Editor to remove the income and Dependents fields 170 Close & Load the data, then rename! the worksheet Pledge Leadse 2. 4P 4P Points Possible Step* Instructions 18 Create a new Power View report (add the Power View button to the Quick Access Toolbar, if necessary). The new sheet will be named Power View1 automatically. If necessary, rename the sheet Power View1. 19Create a visualization table in the upper left corner that displays Operator ID and 5* corresponding Rledge Amount dollars. Do not summarize the Qperator..D column. Format the Operator LDcolumn with General Number Format. - Create a visualization pie chart that displays Pledge-amount by operator in the upper right 21 Create a visualization stacked column chart that spans the lower half of the canvas. The chart 22 Add an appropriate title to the dashboard.+ corner. should display Rledge.Amount andTransactienlD 14 Add the Date field to the Filters area, add Qperator..e to the Rows area, and ado 64 Pledae Amount to the Values area. Add appropriate row and column headings and save the workbook.P 15 Use Power Query to open the database e10c1Contacts.accdb.+ 16- Use the Query Editor to remove the income and Dependents fields 170 Close & Load the data, then rename! the worksheet Pledge Leadse 2. 4P 4P Points Possible Step* Instructions 18 Create a new Power View report (add the Power View button to the Quick Access Toolbar, if necessary). The new sheet will be named Power View1 automatically. If necessary, rename the sheet Power View1. 19Create a visualization table in the upper left corner that displays Operator ID and 5* corresponding Rledge Amount dollars. Do not summarize the Qperator..D column. Format the Operator LDcolumn with General Number Format. - Create a visualization pie chart that displays Pledge-amount by operator in the upper right 21 Create a visualization stacked column chart that spans the lower half of the canvas. The chart 22 Add an appropriate title to the dashboard.+ corner. should display Rledge.Amount andTransactienlDStep by Step Solution
There are 3 Steps involved in it
Step: 1

Get Instant Access to Expert-Tailored Solutions
See step-by-step solutions with expert insights and AI powered tools for academic success
Step: 2

Step: 3
Ace Your Homework with AI
Get the answers you need in no time with our AI-driven, step-by-step assistance
Get Started
Practical Azure SQL Database For Modern Developers Building Applications In The Microsoft Cloud
Authors: Davide Mauri, Silvano Coriani, Anna Hoffma, Sanjay Mishra, Jovan Popovic
1st Edition
1484263693, 978-1484263693