Answered step by step
Verified Expert Solution
Link Copied!

Question

1 Approved Answer

I am in Linear Algebra using MATLAB and I don't know how to program this problem. Please show every step on how to solve it.

I am in Linear Algebra using MATLAB and I don't know how to program this problem. Please show every step on how to solve it. Thanks! I've updated the question with the pictures from the textbook

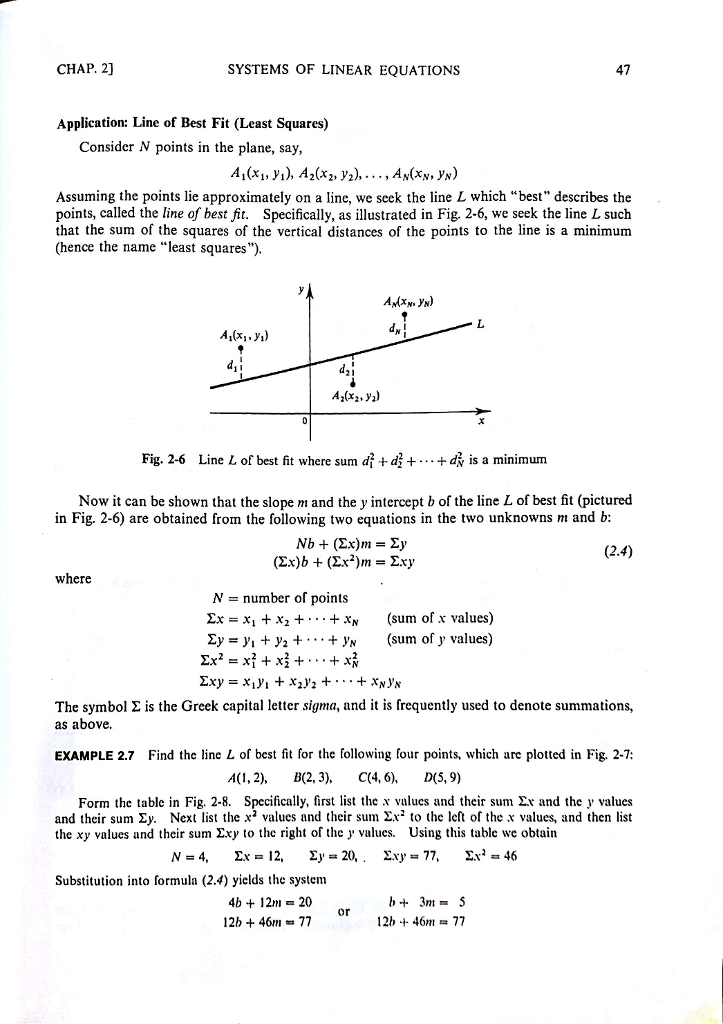
Write an app that employs the method described on pp. 47-48 of Beginning Linear Algebra by Seymour Lipschutz to calculate a least squares straight-line fit to x-y data, and then plots both the data and the fit on the same graph.

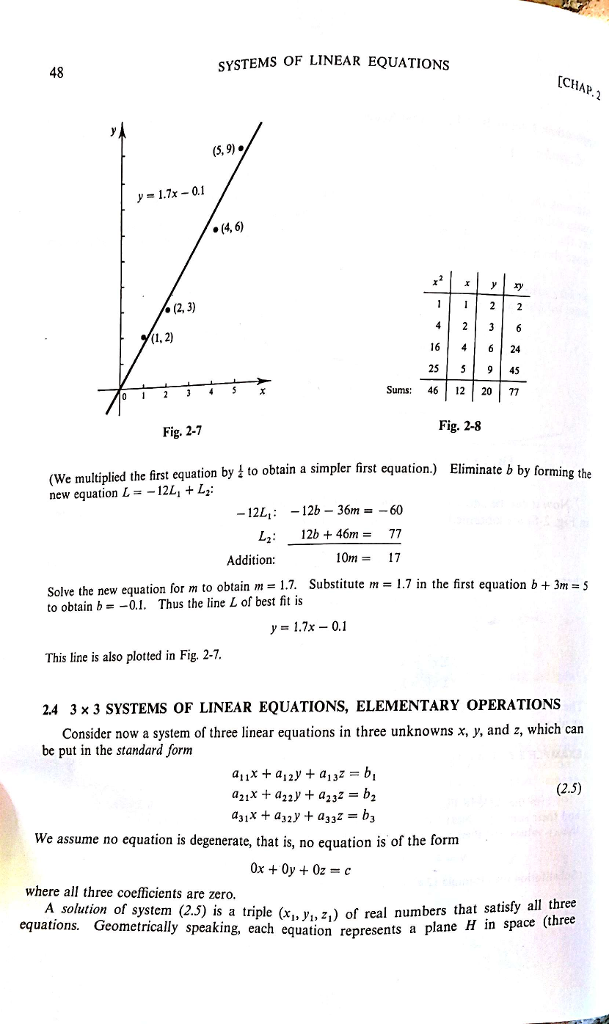
Test the correctness of your app by showing that it reproduces the results given in the text for the data that is presented n Fig. 2.8. T

Run the app with ~20 data points of noisy data that is not uniformly spaced along the x-axis.

Run the app for a set of y data that is obtained using a U[0,1) random number generator. Are the values of m and b what you would expect? Why or why not?

image text in transcribed

image text in transcribed

CHAP. SYSTEMS OF LINEAR EQUATIONS 47 Application: Line of Best Fit east Squares Consider N points in the plane, say, A1(x1, y1), A2(x2, y2) ...,AN(xN, yN) Assuming the points lie approximately on a line, we seek the line L which "best" describes the points, called the line of best fit. Specifically, as illustrated in Fig. 2-6, we seek the line L such that the sum of the squares of the vertical distances of the points to the line is a minimum (hence the name "least squares") A1(x1, y) A2(x2, y2) Fig, 2-6 Line L of best fit where sum di di dir is a minimum Now it can be shown that the slope m and the y intercept b of the line L of best fit (pictured (2.4) where N number of points xx x1 x2 XN (sum of x values) y, y2 yN (sum of y values) Ex X The symbol is the Greek capital letter sigma, and it is frequently used to denote summations, as above. EXAMPLE 2.7 Find the line L of best fit for the following four points, which are plotted in Fig. 2-7: A(1, 2), B(2, 3) C(4, 6), D(5,9) Form the table in Fig. 2-8. Specifically, first list the x ues and their sum yx and the y values and their sum y. Next list the x2 values and their sum Nx2 to the left of the values, and then list the xy values and their sum Exy to the right of the y values. Using this table we obtain 46 Substitution into formula (2.4) yields the system 4b 12m 20 b 3m or 12b 46m 77 12h 46m 77

Step by Step Solution

There are 3 Steps involved in it

Step: 1

blur-text-image

Get Instant Access to Expert-Tailored Solutions

See step-by-step solutions with expert insights and AI powered tools for academic success

Step: 2

blur-text-image

Step: 3

blur-text-image

Ace Your Homework with AI

Get the answers you need in no time with our AI-driven, step-by-step assistance

Get Started

Recommended Textbook for

More Books

Students also viewed these Databases questions

Question

What are the Five Phases of SDLC? Explain each briefly.

Answered: 1 week ago

Question

How can Change Control Procedures manage Project Creep?

Answered: 1 week ago