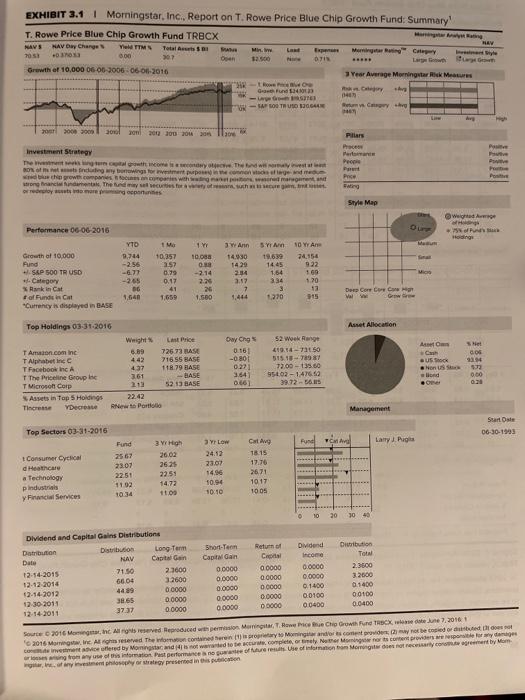
I have $10,000 invested into an index fund with expense ratio of 4 bps (if you don't know what bps is then 1 bp = 0.0001). I also have a T. Rowe TRBCX account and its balance is also $10,000. According the Exhibit 3.1, what is the difference between annual fees for my 2 accounts (take the T. Rowe annual expense fee subtract the mutual fund annual fee)? Round to the nearest cents. HAY EXHIBIT 3.1 | Morningstar, Inc., Report on T. Rowe Price Blue Chip Growth Fund: Summary T. Rowe Price Blue Chip Growth Fund TRBCX NAVE HAV Day Charges ITMS Total Mon Chery 3.00 07 Doen 12.00 Large Growth of 10,000 06-06-2006-06-2016 Year Average Morning Risk Mes Rowe Grund 34 1403 ABOG THU 120.44 y ve 000 2001 3000 2011 2017 10 20 30 30 Pias Pace Pro People have P Investment Strategy The with the Odling my wings for rent pe comedy who grew.com cores with more grandes. They are for a www. Price Style Map We Performance 06-06-2016 Hoding 1 Y SY NO WA 24.156 9.22 770 9.744 -256 -6.77 .-265 06 1,640 Growth of 10,000 Fund SKP 500 TR USD Category Rankin Cat of indt Currency is displayed in BASE IM 10.35 257 0.99 0.17 41 1,650 3 Ann 14.30 1420 234 2.17 7 1.444 10.088 O -2.14 2.26 26 1.500 Micro 1963 14.45 1.64 34 1.20 13 315 Deep Core Core Care 1210 Asset Allocation Owy Ches es 161 Top Holdings 03-31-2016 Last Price T Amazon.com inc 8.89 726 73 RAM T Alphabetic 442 71655 BASE TFacebook in 437 11879 HASE T The Priceline Group 3.61 -BASE T Microson Corp 213 52 13 BASE Assets in Top 5 Holdings 22.42 Tinc Decreate RNews Porto Set 6.08 9814 52 Week Range 1914 - 50 515.1981 7700-135.60 95402-1476.50 39 72 - S -080 0.221 US Hon US 0.00 0.66 Management Start Ote 06-30-1993 Top Sectos 03-31-2016 Calvo Fund Langes Consumer Cyclical dHeathcare Technology pIndustrial yFin Services Fund 2567 23:07 22 50 1192 3 W High 26.03 26.25 22.51 14.72 11.0 3 Y LOW 24.12 23.07 14.96 10.94 10.10 18.15 17.76 2671 1017 1005 -- 10 20 30 40 Dividend and Capital Gains Distributions Distribution Distribution Long Term Date NAV Capital Gain 12-14-2015 71.50 2.3600 12-12-2014 6604 12-14-2012 4009 0.0000 12-30 2011 38.65 0.0000 12-14-2011 3737 0.0000 Short-Term Capitan 0.0000 0.0000 0.0000 0.0000 0.0000 Return of Cro 0.0000 00000 0.0000 0.0000 00000 Dividend Income 0.0000 0.0000 0.1400 0.0100 0.0400 3.2600 Dribution Total 2.3600 3.2000 01400 0.0100 0.0400 Source 2016 Matinc All reserved Reproduced with permission Marina Hewice Blue Cho Growth TRBCX, dene 7, 2016 2016 Martie Aghireserved the contained here to Moening and comes wide varios de copied due to come invece offered by Morning and wanted to the comporrey Neer Morning norte content provides pidamages Wong from or information Past performano go of Mr. Use of information om Mortos necessary.crement by Mom investment or they presented in this mon