

Answered step by step
Verified Expert Solution
Question
1 Approved Answer
I need help with questions 2 through 4. Can someone help guide me in doing these? I am completely stuck on 2, and that is
 I need help with questions 2 through 4. Can someone help guide me in doing these? I am completely stuck on 2, and that is needed for the rest.
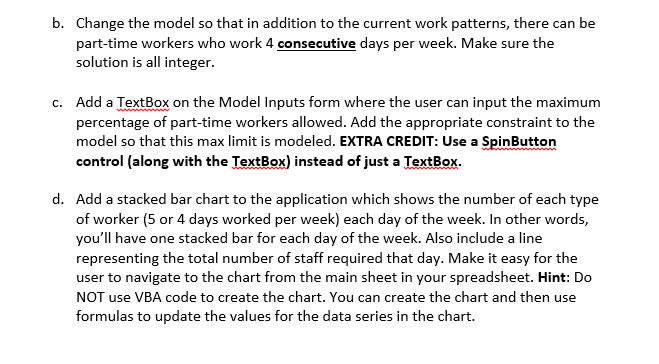
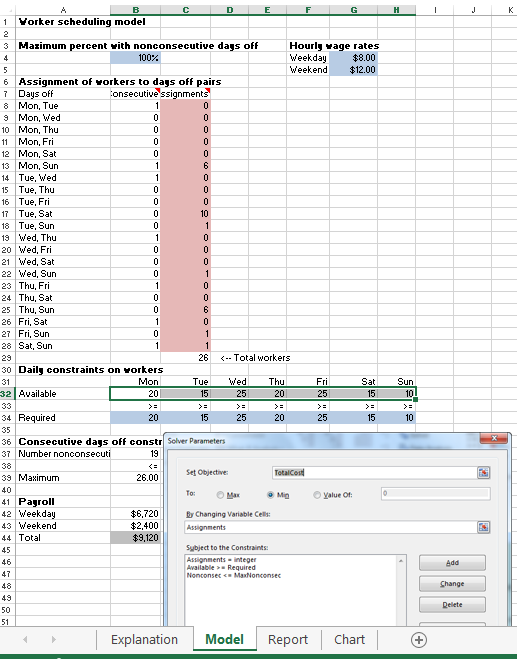
b. Change the model so that in addition to the current work patterns, there can be part-time workers who work 4 consecutive days per week. Make sure the solution is all integer Add a TextBox on the Model Inputs form where the user can input the maximum percentage of part-time workers allowed. Add the appropriate constraint to the model so that this max limit is modeled. EXTRA CREDIT: Use a SpinButton control (along with the TextBox) instead of just a TextBox- c. d. Add a stacked bar chart to the application which shows the number of each type of worker (5 or 4 days worked per week) each day of the week. In other words, you'll have one stacked bar for each day of the week. Also include a line representing the total number of staff required that day. Make it easy for the user to navigate to the chart from the main sheet in your spreadsheet. Hint: Do NOT use VBA code to create the chart. You can create the chart and then use formulas to update the values for the data series in the chart. b. Change the model so that in addition to the current work patterns, there can be part-time workers who work 4 consecutive days per week. Make sure the solution is all integer Add a TextBox on the Model Inputs form where the user can input the maximum percentage of part-time workers allowed. Add the appropriate constraint to the model so that this max limit is modeled. EXTRA CREDIT: Use a SpinButton control (along with the TextBox) instead of just a TextBox- c. d. Add a stacked bar chart to the application which shows the number of each type of worker (5 or 4 days worked per week) each day of the week. In other words, you'll have one stacked bar for each day of the week. Also include a line representing the total number of staff required that day. Make it easy for the user to navigate to the chart from the main sheet in your spreadsheet. Hint: Do NOT use VBA code to create the chart. You can create the chart and then use formulas to update the values for the data series in the chart
Step by Step Solution
There are 3 Steps involved in it
Step: 1

Get Instant Access to Expert-Tailored Solutions
See step-by-step solutions with expert insights and AI powered tools for academic success
Step: 2

Step: 3
Ace Your Homework with AI
Get the answers you need in no time with our AI-driven, step-by-step assistance
Get Started
Database Design And Relational Theory Normal Forms And All That Jazz
Authors: Chris Date
1st Edition
1449328016, 978-1449328016