Answered step by step
Verified Expert Solution
Link Copied!

Question

1 Approved Answer

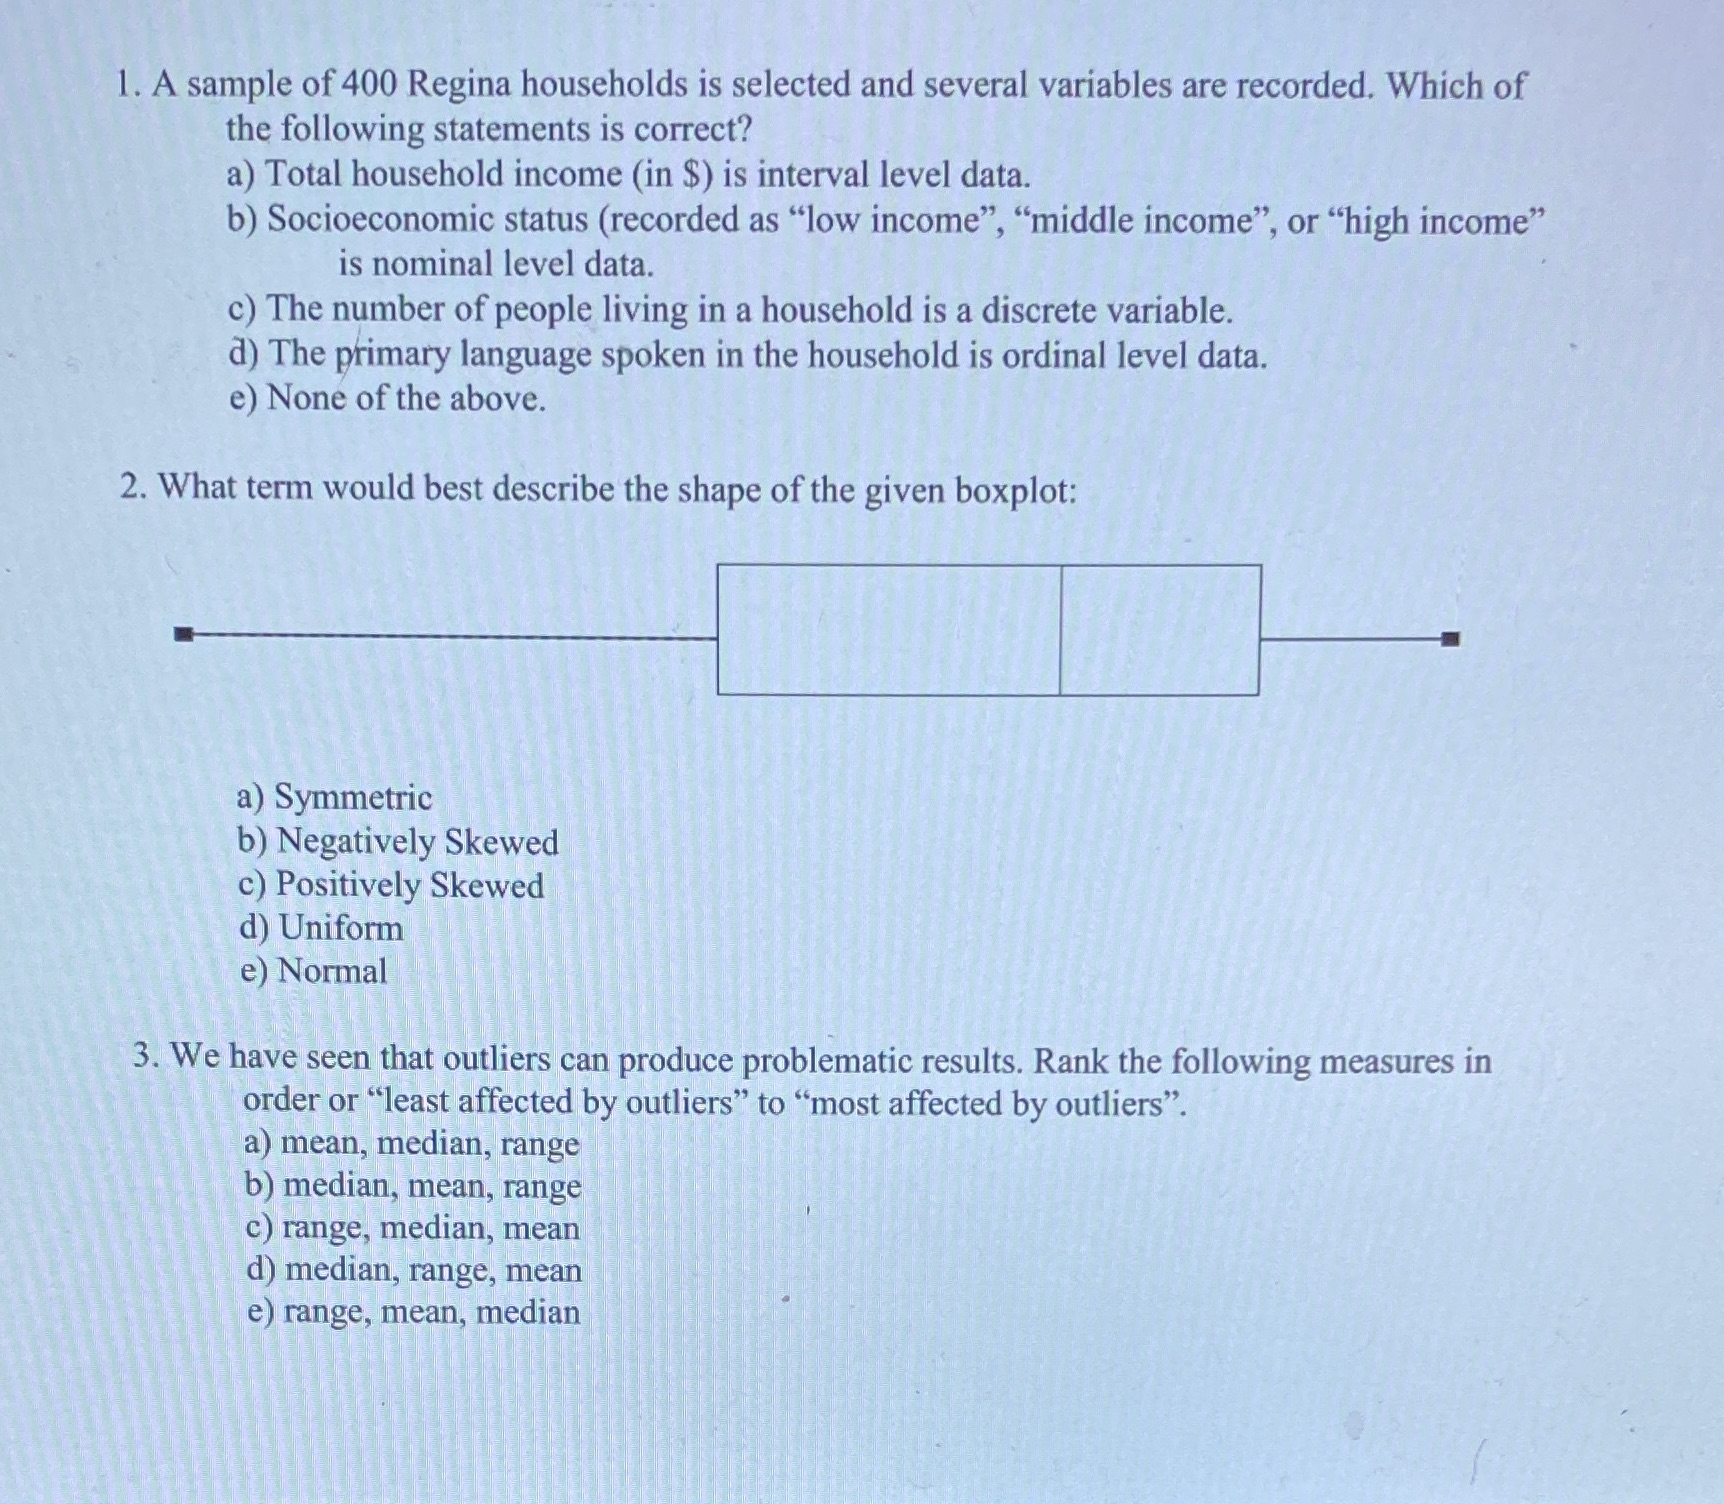
I need help with this can someone explain 1. A sample of 400 Regina households is selected and several variables are recorded. Which of the

I need help with this can someone explain

image text in transcribed
1. A sample of 400 Regina households is selected and several variables are recorded. Which of the following statements is correct? a) Total household income (in $) is interval level data. b) Socioeconomic status (recorded as "low income", "middle income", or "high income" is nominal level data. c) The number of people living in a household is a discrete variable. d) The primary language spoken in the household is ordinal level data. e) None of the above. 2. What term would best describe the shape of the given boxplot: a) Symmetric b) Negatively Skewed c) Positively Skewed d) Uniform e) Normal 3. We have seen that outliers can produce problematic results. Rank the following measures in order or "least affected by outliers" to "most affected by outliers". a) mean, median, range b) median, mean, range c) range, median, mean d) median, range, mean e) range, mean, median

Step by Step Solution

There are 3 Steps involved in it

Step: 1

blur-text-image

Get Instant Access to Expert-Tailored Solutions

See step-by-step solutions with expert insights and AI powered tools for academic success

Step: 2

blur-text-image

Step: 3

blur-text-image

Ace Your Homework with AI

Get the answers you need in no time with our AI-driven, step-by-step assistance

Get Started

Recommended Textbook for

Finite Math And Applied Calculus

Authors: Stefan Waner, Steven Costenoble

2nd Edition

0534366309, 9780534366308

More Books

Students also viewed these Mathematics questions